Greenhouse Lighting Layout 2026: 10 Steps & Glossary
Design a greenhouse lighting layout with 10 steps and a complete glossary—PPFD, DLI, spacing, mounting height, and uniformity. Get the 2026 guide.
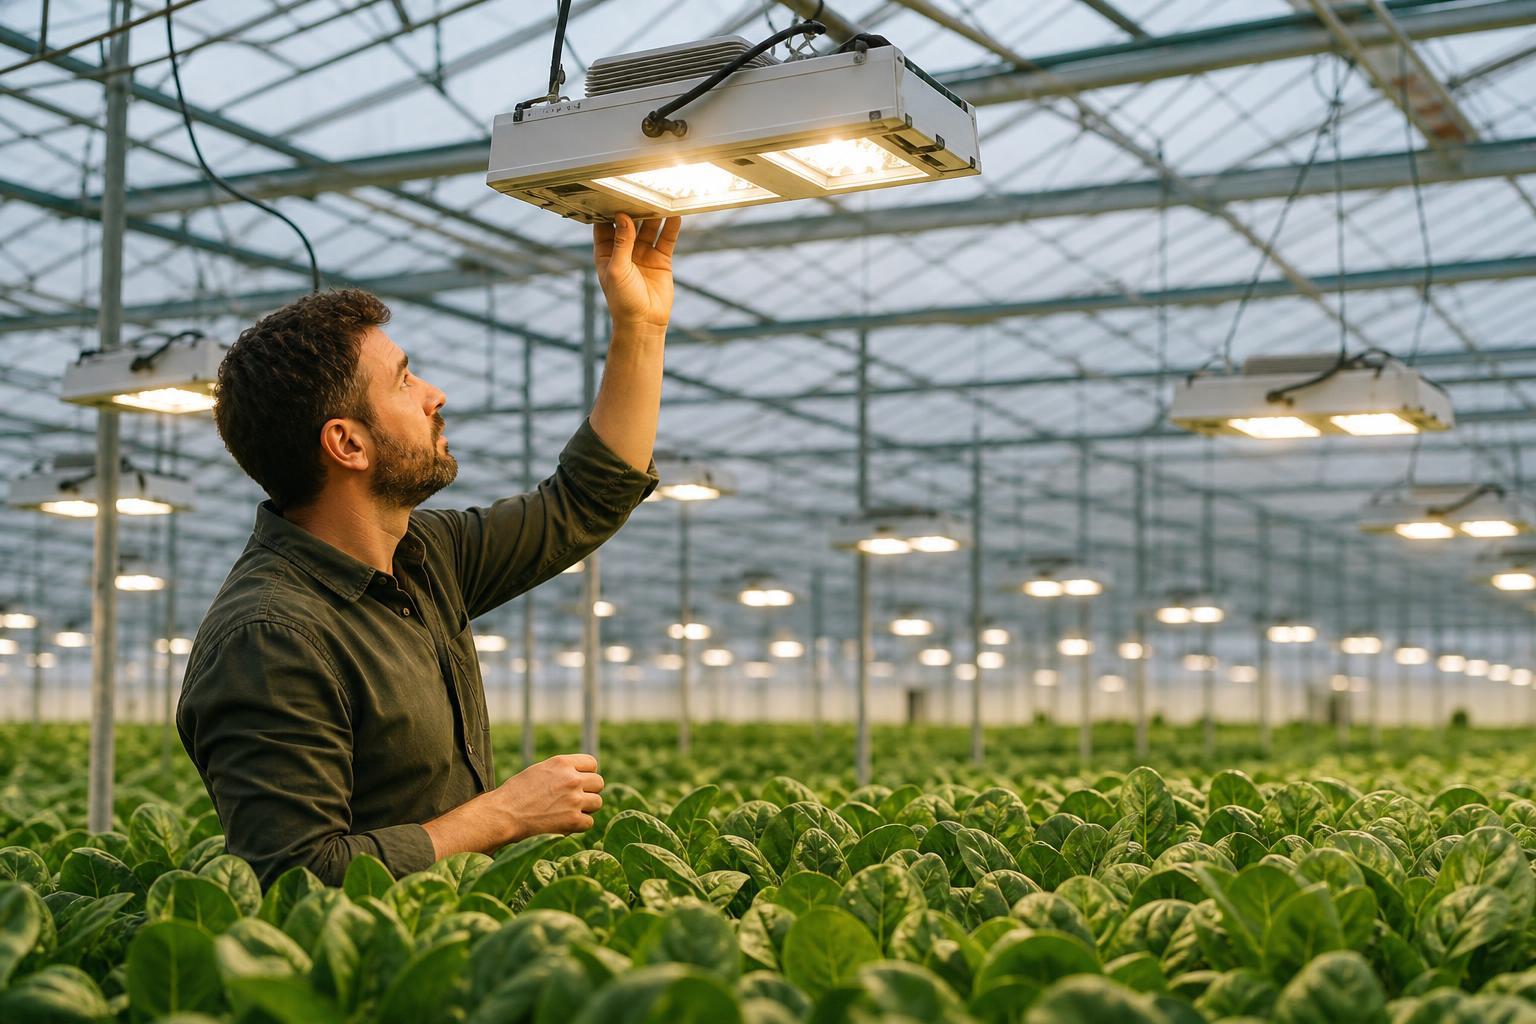
TL;DR
A greenhouse lighting layout is the planned arrangement of supplemental light fixtures, specifying their type, quantity, spacing, mounting height, and orientation to deliver uniform PPFD across the growing area. Getting it right requires understanding a handful of core metrics (PPFD, DLI, PPE, uniformity), accounting for your greenhouse structure and natural light, and avoiding common mistakes like weak edges and overestimated winter light transmission. This glossary defines every term you will encounter when designing or evaluating a greenhouse light plan, including the critical choice between grid and row fixture arrangements.
Greenhouse lighting projects fail for a predictable reason: the people making decisions don’t share a common vocabulary. The head grower talks DLI targets. The electrician talks demand loads and GFCI protection. The contractor quotes conduit runs and voltage drop. Without a shared reference, you get oversized panels, undersized feeders, and layouts that look great on paper but underperform at the canopy.
This glossary exists to fix that. Every term is organized into thematic clusters, defined in plain English, and connected to the practical stakes of getting your greenhouse lighting layout right.
If you are evaluating a vendor’s light plan or speccing a new project, a free consultation with a lighting expert can help you translate these concepts into a layout tailored to your facility.
What Is a Greenhouse Lighting Layout?
A greenhouse lighting layout is a plan showing where supplemental fixtures should be installed, how many are required, their spacing and mounting height, and the PPFD they are expected to deliver across the crop canopy. A good layout balances crop DLI requirements, natural sunlight, fixture output, light uniformity, greenhouse structure, electrical capacity, and seasonal conditions.
In practice, the goal is not simply to install enough lights. The goal is to deliver the right amount of usable light, as evenly as possible, where the crop needs it.
The 5 Things Every Greenhouse Lighting Layout Should Specify
Target PPFD: How much supplemental light the crop needs at canopy level.
Target DLI: How much total light the crop should receive over 24 hours.
Fixture quantity and output: How many fixtures are required and how much photon output each provides.
Spacing and mounting height: Where fixtures are positioned and how high they are installed.
Uniformity: How consistently PPFD is distributed across the productive growing area.
A professional layout should also account for natural sunlight, greenhouse glazing, structural shadows, energy curtains, HVAC equipment, electrical infrastructure, and seasonal changes in available light.
How to Design a Greenhouse Lighting Layout
Designing a greenhouse lighting layout starts with the crop’s light requirement and works backward to fixture placement. The process should account for both sunlight and supplemental lighting rather than treating artificial lighting as a standalone system.
Step 1: Determine the Crop’s Target DLI
Start by establishing the target daily light integral for the crop and growth stage. DLI is the total amount of photosynthetically active radiation received by the crop over a 24 hour period.
Do not use a single DLI target for an entire facility if different zones contain different crops or growth stages. Seedlings, leafy greens, vegetative crops, flowering crops, and fruiting crops can have substantially different light requirements. For detailed crop targets, the greenhouse DLI calculator breaks down requirements by species.
Step 2: Estimate Available Natural Light
Determine how much sunlight reaches the crop canopy during the relevant season. Account for greenhouse glazing, dirt, structural shading, energy curtains, sun angle, and local climate conditions.
For a supplemental lighting design, the important number is not the amount of sunlight outside the greenhouse. It is the amount of usable light that actually reaches the crop.
Step 3: Calculate the Supplemental Light Requirement
Once the natural DLI contribution is known, calculate the remaining DLI that must be supplied by artificial lighting.
The basic relationship is:
Supplemental DLI = Target DLI − Natural DLI
The supplemental DLI can then be converted into a required average supplemental PPFD based on the planned photoperiod.
Step 4: Select the Fixture
Compare fixtures based on more than wattage. Important specifications include:
- PPF
- PPE
- Spectral output
- Beam distribution
- Dimming capability
- Operating temperature
- Mounting requirements
- Environmental rating
- Warranty
- Expected service life
Fixture efficacy determines how efficiently electricity is converted into usable photons, while the optical distribution determines where those photons land. For greenhouse toplighting applications, the Altus 1K is a 1050W fixture designed for exactly this use case.
Step 5: Establish the Mounting Height
Set the fixture mounting height based on the greenhouse structure, crop canopy, fixture optics, and required uniformity.
Mounting height should be established before finalizing the fixture spacing because the two variables interact. Raising a fixture generally spreads light over a larger area, while lowering it can increase intensity but produce stronger spatial variation. The greenhouse grow light height guide covers the tradeoffs in detail.
Step 6: Choose the Fixture Arrangement: Grid vs. Row Layout
This step is where many growers face their first real design fork. The two dominant arrangement patterns for greenhouse supplemental lighting are grid layouts and row layouts. Each has distinct advantages, and the right choice depends on greenhouse structure, crop geometry, and fixture type.
Grid layout places fixtures in a staggered or rectangular matrix across the entire growing area. Each fixture sits at a defined X and Y coordinate, creating a checkerboard of overlapping light footprints. Grid arrangements excel at delivering high uniformity across wide, open canopies because every point on the growing surface receives contributions from multiple fixtures in different directions. They are the default choice for broad, low canopy crops like lettuce, herbs, and cannabis sea of green production.
Row layout arranges fixtures in parallel lines, typically aligned with crop rows, gutters, or structural bays. Row layouts are natural fits for gutter connected greenhouses and high wire crops like tomatoes and cucumbers, where the growing rows themselves are linear. The fixture rows can be positioned directly above crop rows, concentrating photons where plants actually grow rather than wasting light on aisles.
How they compare in practice:
| Factor | Grid Layout | Row Layout |
|---|---|---|
| Uniformity across open canopy | Higher (overlapping footprints from multiple directions) | Moderate (strong along row axis, weaker between rows) |
| Match to linear crop geometry | Requires adjustment | Natural fit for row crops |
| Gutter connected greenhouse fit | Can conflict with truss spacing | Aligns easily with structural bays |
| Perimeter coverage | Easier to bias fixtures toward edges | Requires careful end of row positioning |
| Wiring and conduit | More complex routing | Simpler runs along row direction |
| Maintenance access | Access needed from multiple directions | Service along row corridors |
Practitioners on grower forums frequently note that row layouts simplify installation and wiring in large gutter connected greenhouses because conduit can follow the structural bays without crossing trusses. One greenhouse lighting engineer shared in a YouTube walkthrough that switching from a grid to a row arrangement in a 10 acre tomato range cut wiring costs by roughly 15% while maintaining target PPFD, because fixtures sat directly on existing structural members rather than requiring custom mounting points.
Grid layouts, on the other hand, tend to win in open canopy applications where crop rows don’t dictate a single axis. In cannabis facilities, where sea of green canopies cover the entire floor, a staggered grid with 10 to 20% overlap between adjacent fixture footprints produces the smoothest PPFD distribution.
The hybrid approach: Many commercial operations use a combination. A tomato greenhouse might run row mounted toplights above the crop rows while adding grid positioned interlighting modules between plants at mid canopy. The key is that the arrangement pattern serves the crop geometry, not the other way around.
Regardless of which pattern you choose, always simulate the resulting PPFD map before committing to installation. A grid with poor spacing is worse than a well designed row layout, and vice versa.
Step 7: Create the Fixture Grid
Lay out the fixtures across the productive growing area rather than simply dividing the greenhouse into equal squares.
Pay particular attention to:
- Perimeter rows
- Corners
- Aisles
- Structural obstructions
- Crop free areas
- Energy curtains
- HVAC equipment
- Doors and access areas
The objective is to place photons where plants are actually growing.
Step 8: Simulate PPFD and Uniformity
Use the fixture’s photometric or horticultural lighting data to model the expected PPFD distribution.
Evaluate average PPFD alongside minimum PPFD, maximum PPFD, and a uniformity metric. A high average can hide significant underlit areas.
Step 9: Check Electrical and Structural Constraints
Before approving the layout, verify that the fixture count and connected load can be supported by the greenhouse’s electrical infrastructure.
Also check mounting points, structural loads, conduit routes, driver locations, HVAC clearance, energy curtains, and maintenance access.
Step 10: Verify the Installed System
After installation, measure PPFD at the canopy using a consistent grid. Compare the measured results with the original simulation.
If the installed system differs substantially from the design, investigate fixture position, mounting height, obstructions, driver performance, dimming settings, and installation tolerances.
Greenhouse Lighting Layout: Design Sequence
Crop DLI target → Natural DLI → Supplemental DLI → Required PPFD → Fixture selection → Grid vs. row arrangement → Mounting height → Fixture spacing → PPFD simulation → Electrical review → Installation → PPFD verification
This sequence prevents fixture selection from driving the design before the crop, environment, and growing area have been properly defined.
Core Metrics and Measurements
These are the numbers that drive every greenhouse lighting layout decision. If you understand these six metrics, you can read any light plan and ask the right questions.
PPFD (Photosynthetic Photon Flux Density)
The instantaneous intensity of photosynthetically active light hitting the canopy, measured in µmol/m²/s. This is what your layout planning aims to deliver, uniformly, across every square meter of growing space.
Why it matters for layout: The entire fixture count, spacing grid, and mounting height calculation traces back to a target PPFD number. Leafy greens typically require 150 to 250 µmol/m²/s. Cannabis in flower commonly targets 800 to 1,000 µmol/m²/s or higher. The proper question for any layout is: “How many fixtures do I need to achieve X PPFD in a Y sized grow?”
For a deeper breakdown, see the guide on PPF vs. PPFD and when to use each metric.
PPF (Photosynthetic Photon Flux)
PPF is the total amount of photosynthetically active photon output produced by a lighting fixture, measured in µmol/s. Unlike PPFD, which measures photon density at a specific location, PPF describes the fixture’s total photon output.
PPF answers: “How many photons does this fixture produce?”
PPFD answers: “How many of those photons reach this square meter of canopy?”
PPF is therefore useful when comparing fixture output, while PPFD is the more important metric when evaluating what the crop actually receives.
For greenhouse lighting layouts, fixture PPF is one of the primary inputs used to estimate fixture quantity. The final layout must still account for mounting height, optical distribution, spacing, and uniformity.
| Metric | What it measures | Unit | Main layout use |
|---|---|---|---|
| PPF | Total photon output from a fixture | µmol/s | Comparing fixture output |
| PPFD | Photon density reaching the canopy | µmol/m²/s | Setting and verifying light intensity |
| DLI | Total photons received over a day | mol/m²/day | Determining daily crop light requirement |
| PPE | Photon output per unit of electrical energy | µmol/J | Comparing energy efficiency |
| Uniformity | How evenly PPFD is distributed | % or ratio | Evaluating fixture placement |
DLI (Daily Light Integral)
Total photon delivery over a 24 hour period, measured in mol/m²/day. While PPFD tells you intensity at any given moment, DLI tells you whether the plant received enough total light to hit its growth targets for the day. DLI is the ultimate metric; PPFD and photoperiod are just the levers that achieve it.
Formula: DLI (mol/m²/day) = PPFD (µmol/m²/s) × Photoperiod (hours) × 3600 / 1,000,000
Crop classification by DLI: Low light crops need 3 to 6 mol/m²/d, medium light crops need 6 to 12, high light crops need 12 to 18, and very high light crops need more than 18. See the reference table at the bottom of this page for specific crop targets.
A critical variable: the available light inside a greenhouse can range from 50% to 90% of outside light depending on glazing material, age, and cleanliness. Your supplemental layout fills whatever gap remains between what the sun provides and what your crop demands. The DLI formula and conversion guide walks through the math step by step.
PPE (Photosynthetic Photon Efficacy)
Fixture efficiency, measured in µmol/J (micromoles of photons per joule of electricity consumed). Higher PPE means more photons per watt, which means fewer fixtures or lower wattage to reach the same PPFD target.
Benchmarks: Efficacy values range from roughly 0.9 µmol/J for older 400W HPS fixtures with magnetic ballasts to 2.0 to 2.7 µmol/J for modern LED fixtures. An LED at 2.7 µmol/J emits three times the photosynthetic light per watt compared to that 400W HPS. When comparing fixtures, be careful about how manufacturers measure and report efficacy, as the common mistakes comparing LEDs to HPS are well documented.
Lighting Uniformity

How evenly PPFD is distributed across the growing area. This is arguably the most underappreciated metric in greenhouse lighting layout design.
Why it matters more than peak intensity: Uneven photon distribution creates uneven plants, and uneven plants cost money. Horticultural lighting scientists consistently rank uniformity as equally important as raw PPFD output for crop consistency and yield optimization. A layout that delivers 600 µmol/m²/s in the center but 350 at the edges will produce wildly inconsistent harvests regardless of how impressive that center number looks.
Targets: Industry standard targets call for canopy PPFD uniformity within ±10 to 15% of the mean, with a coefficient of variation (CV) below 15%. Runkle (2017) recommended that a 10 to 20% variation in intensity is generally acceptable, while Yelton (2017) proposed that ±5% is a more appropriate target for commercial greenhouse and plant factory applications.
Two measurement approaches: Min/Avg ratio (Uₘᵢₙ/ₐᵥg), which compares the lowest reading to the average, and Coefficient of Variation (CV%), which captures overall spread.
How grid and row layouts affect uniformity differently: Grid layouts inherently produce higher two dimensional uniformity because each canopy point receives light from fixtures in multiple directions. Row layouts can achieve excellent uniformity along the row axis but may show periodic dips between rows if spacing is too wide. Practitioners on Reddit report that adding a slight offset (staggering every other row by half the fixture spacing) in a row layout can close most of the uniformity gap versus a full grid, without adding any extra fixtures.
Photoperiod
The number of hours per day that supplemental lights run. Photoperiod interacts directly with PPFD to determine DLI, and how you split that interaction has real consequences.
Research from the University of Georgia found that plants grown under the same DLI but with lower PPFD over longer photoperiods were approximately 30% larger than those receiving higher PPFD over shorter photoperiods. Extending the photoperiod resulted in higher light use efficiency and energy use efficiency. The layout implication is significant: you may need fewer fixtures running longer rather than more fixtures for fewer hours.
Caveat: Photoperiod sensitive crops, including flowering cannabis, require at least 4 to 6 hours of uninterrupted darkness per day. For more on scheduling strategies, see the greenhouse lighting schedule guide.
Light Transmission Rate
The percentage of outdoor sunlight that reaches the canopy through greenhouse glazing. This number determines how much supplemental light your layout must provide.
The common calculation error: Growers assume their glass greenhouse delivers 80 to 90% natural light transmission year round. While that may be accurate at noon in summer, in winter when sun angle is low, transmission can drop to 50 to 60%. The resulting deficit can leave crops 2 to 3 moles short of their daily DLI target, every single day, for months. The winter greenhouse lighting glossary explains exactly how seasonal transmission losses compound.
How to Calculate a Greenhouse Lighting Layout
The basic greenhouse lighting calculation connects the crop’s DLI target with natural sunlight, supplemental PPFD, photoperiod, fixture output, and growing area.
DLI to PPFD Conversion
The basic relationship is:
DLI = PPFD × Photoperiod × 3,600 ÷ 1,000,000
Rearranged to calculate the required average PPFD:
PPFD = DLI × 1,000,000 ÷ (Photoperiod × 3,600)
For example, if a crop requires 20 mol/m²/day and supplemental lighting will operate for 12 hours:
PPFD = 20 × 1,000,000 ÷ (12 × 3,600)
PPFD ≈ 463 µmol/m²/s
This is the theoretical average supplemental PPFD required if the entire 20 mol/m²/day must come from artificial lighting.
Calculate the Supplemental DLI Deficit
If the crop target is 20 mol/m²/day and the greenhouse provides an estimated 12 mol/m²/day of natural DLI:
Supplemental DLI = 20 − 12 = 8 mol/m²/day
The lighting system therefore needs to provide approximately 8 mol/m²/day of supplemental light.
Estimate Total Fixture Count
A simplified fixture count calculation is:
Fixture count ≈ Growing area × Required supplemental PPF density ÷ Fixture PPF
However, this is only a starting estimate. A real layout must account for fixture spacing, optical distribution, mounting height, perimeter losses, structural obstructions, and uniformity.
For this reason, fixture count should ultimately be determined from a photometric or horticultural lighting simulation rather than from wattage alone.
Why Wattage Alone Is Not Enough
Two fixtures can consume the same amount of electricity but produce different amounts of photosynthetic light.
For greenhouse lighting, compare:
- Watts: Electrical power consumption
- PPF: Total photon output
- PPFD: Photon density reaching the crop
- PPE: Photon output per joule
- Uniformity: How evenly photons are distributed
A 1,000W fixture is not automatically equivalent to another 1,000W fixture. Fixture efficacy and optical distribution determine how effectively that electrical input becomes useful canopy light.
Example Greenhouse Layout Calculation
| Variable | Example |
|---|---|
| Growing area | 1,000 m² |
| Target DLI | 20 mol/m²/day |
| Natural DLI contribution | 12 mol/m²/day |
| Supplemental DLI required | 8 mol/m²/day |
| Supplemental photoperiod | 12 hours |
| Required average supplemental PPFD | ~185 µmol/m²/s |
| Fixture PPE | 2.7 µmol/J |
| Fixture power | 1,000 W |
| Fixture PPF | 2,700 µmol/s |
The resulting fixture count still needs to be validated through a layout simulation because the theoretical calculation does not show where the photons land.
Important: Actual fixture requirements depend on the manufacturer’s measured PPF, mounting height, optical distribution, greenhouse geometry, natural light contribution, and required uniformity. Treat simplified calculations as sizing estimates, not installation specifications.
Need help running these numbers for your specific facility? Talk to a lighting design expert to get a simulation built around your greenhouse dimensions, crops, and climate.
Layout Design Factors
These are the physical variables that determine whether your greenhouse lighting layout actually delivers the metrics above.
Fixture Spacing
Center to center distance between fixtures. This is where uniformity is won or lost.
A 10 to 20% overlap between adjacent fixture footprints eliminates dark zones without creating hotspots. Smooth light fields require that overlap to be consistent across the entire canopy. The perimeter is where most layouts fail.
Practitioners on grower forums regularly point out that fixture spacing affects crop uniformity as much as fixture efficiency. Poor spacing often causes larger yield losses than choosing a slightly less efficient fixture. Get the grid right first, then optimize the hardware.
Mounting Height
Distance between the fixture’s light emitting surface and the top of the canopy. Small changes have outsized effects.
A 5 cm change in mounting height at typical multi tier distances can alter PPFD by 20 to 30%. A fixture installed just 5 cm too high delivers roughly one quarter less light than the design specified. Conversely, lowering a fixture quickly increases center intensity but degrades edge coverage. The center improves while the edges fall farther behind.
Practical note: Mounting height is constrained by greenhouse structure, energy curtains, and HVAC ducting. Specifying lighting after those systems are installed is one of the most common (and expensive) sequencing mistakes. One lighting design specialist’s advice: first add the energy curtain, then plan the full LED conversion.
Beam Angle
The angular spread of light from a fixture. Wide beam angles (120° or more) spread light to the edges and help fill perimeter zones. Narrower angles concentrate light in the center and are useful for high bay applications with greater mounting heights.
Beam angle selection interacts with spacing and mounting height. You cannot evaluate one in isolation. A narrow beam fixture mounted too low creates intense hotspots with severe dropoff. A wide beam fixture mounted too high wastes photons on aisles and walls.
Fixture Shadow and Light Obstruction
Supplemental lighting fixtures don’t just add light. They also block some of the natural sunlight they’re supplementing. This is a layout factor that almost no one talks about.
A common agricultural luminaire can obscure as much as 28.7% of incident light falling onto the plant canopy. That shadow cost compounds across hundreds of fixtures. The slimmer the fixture profile, the less sunlight it steals.
Pro tip from practitioners: Always align linear LED fixtures directly beneath or parallel to major structural trusses and purlins. Positioning the luminaire within the shadow cone already cast by a structural steel beam prevents the fixture from creating an additional shadow path. This one alignment decision can recover several percent of natural DLI at zero cost.
Greenhouse Orientation
The direction the greenhouse faces determines natural light patterns across the growing area and directly affects where supplemental lighting needs to compensate.
Gutter connected greenhouses should be oriented north/south, regardless of latitude, to minimize shading from trusses as the sun tracks east to west. Free standing greenhouses above latitude 40°N benefit from east/west orientation to allow maximum low angled winter light from the sides.
If you are designing a new facility, explore supplemental lighting strategies that account for both orientation and structure type.
Layout Types and Lighting Strategies
A greenhouse lighting layout is rarely one size fits all. Most commercial operations combine multiple strategies across different zones and crop stages.
Toplighting
Standard overhead fixture placement delivering PPFD to the upper canopy. This is the starting point for every greenhouse layout. Commercial LED toplighting fixtures for greenhouse use typically range from 600W to 1,050W and need careful spacing to ensure uniform coverage.
Interlighting (Intercanopy Lighting)
Fixtures placed within the plant canopy to illuminate shaded middle and lower leaves. High wire crops like tomatoes experience rapid light falloff toward the lower canopy. When abundant light is supplied from above, further increasing upper illumination does not yield additional benefits, as it saturates upper leaves while deeper layers remain light starved.
Research shows that combined intra canopy and top lighting (50/50 split) produced more uniform light absorption than either method alone. Intra canopy lighting resulted in 8% higher total light absorption than top lighting alone.
Under Canopy Lighting
Fixtures positioned below the main canopy, directing light upward to lower leaves and bud sites. This strategy has moved from experimental curiosity to proven production technique.
Both subcanopy lighting (SCL) and inter canopy lighting (ICL) resulted in more uniform light distribution and increased yields. ICL achieved a 29.95% increase in dry inflorescence yield, 24.4% higher THC accumulation, and 12.5% increase in total terpene concentration. For the full research summary, read under canopy lighting results.
Photoperiod Lighting vs. Supplemental Lighting
These are two distinct strategies that serve different purposes. Photoperiod lighting extends day length at low intensity (often just 1 to 2 µmol/m²/s) to trigger or prevent flowering responses. Supplemental lighting adds meaningful PPFD, typically 100 to 400+ µmol/m²/s, to boost photosynthesis and DLI.
A greenhouse lighting layout must account for both. Photoperiod fixtures are cheap and low wattage but must cover the entire growing area. Supplemental fixtures are the heavy investment and the focus of layout planning.
Light Zones
Dividing a greenhouse into zones with different lighting prescriptions based on crop type, growth stage, or structural constraints. Seedlings, vegetative growth, flowering, fruiting, and propagation areas can each need different DLI targets, spectra, photoperiods, and mounting heights.
Zoning is where greenhouse lighting layout moves from a simple grid exercise to a true design challenge. Each zone may require its own spacing pattern, control schedule, and electrical feed.
Greenhouse Lighting Layout by Structure Type
The best lighting layout depends partly on the physical design of the greenhouse. Fixture placement that works in one structure may create unnecessary shading or maintenance problems in another.
Gutter Connected Greenhouses
Gutter connected structures have repeating bays, shared gutters, structural members, and potentially large continuous growing areas. Lighting layouts should account for repeating structural shadows and ensure that fixture rows align with productive growing zones. Row layouts tend to be the natural starting point here because the structural bays create a built in grid that fixtures can follow.
Free Standing Greenhouses
Free standing houses generally provide more flexibility in fixture placement but can have different perimeter conditions and natural light patterns. The layout should account for wall proximity, roof geometry, and seasonal solar exposure. Grid layouts often work well in free standing houses because the growing area is typically a single open rectangle without repeating bay constraints.
High Wire Greenhouses
High wire crops such as tomatoes and cucumbers create a deeper canopy than many low growing crops. Toplighting may provide strong upper canopy illumination while interlighting can improve light penetration deeper into the crop. Row layouts aligned with the crop wire direction are standard here, with interlighting bars mounted horizontally between rows.
Multi Zone Greenhouses
Facilities growing multiple crops or growth stages should consider separate lighting zones rather than applying one PPFD target across the entire facility. Zoning allows lighting intensity, photoperiod, and operating schedules to be matched to crop requirements. Different zones within the same greenhouse may use different arrangement patterns (grid in the lettuce propagation area, rows over the tomato bays) depending on what serves each crop best.
Design Process and Tools
Light Plan (Photometric Layout)
A software generated map showing predicted PPFD distribution across the growing area before a single fixture is installed. Computer aided lighting simulation tools model light distribution patterns considering canopy height, greenhouse dimensions, and fixture specifications.
Important caveat: Architectural lighting design programs (DIALux, for example) are built for human vision, not horticulture. They make it difficult to calculate PPFD and DLI properly. Horticultural light plans require IES photometric files from the fixture manufacturer and software that can model PAR output, not just lumens.
A good light plan provides an accurate simulation of the quantity and layout of artificial lights required for your location, figuring out the minimum supplemental lighting needed by considering natural light and DLI.
PPFD Map (Grid Mapping)
Post installation measurement of PPFD at multiple points across the canopy to verify that the light plan’s predictions match reality. Growers compare minimum to maximum spread or use grid based mapping to identify problem areas. The goal: fewer overlit patches, fewer underlit corners, and better consistency across the productive footprint.
For measurement techniques, the guide on how to measure PPFD covers sensor selection and sampling protocols.
How to Verify a Greenhouse Lighting Layout After Installation
The installed lighting system should be measured rather than assumed to match the design simulation.
Take PPFD measurements at consistent points across the productive canopy, including:
- Center areas
- Perimeter rows
- Corners
- Areas beneath structural obstructions
- Areas near aisles
- Areas beneath or beside energy curtains
- Any zone where fixture spacing changes
Calculate the average, minimum, and maximum PPFD and compare the measured distribution with the original light plan.
If the measured values are substantially different from the simulation, check fixture mounting height, fixture position, dimming settings, installation tolerances, obstructions, and the assumptions used in the original model.
The goal of commissioning is not simply to confirm that every fixture turns on. It is to confirm that the crop canopy receives the intended light distribution.
Design to Install Variance
The gap between what the light plan predicted and what the installed system actually delivers. This is one of the most important numbers to ask any lighting vendor about, because a beautiful simulation means nothing if the as built system misses by 20%.
What Should a Greenhouse Lighting Plan Include?
A professional greenhouse lighting plan should show more than the number of fixtures required. It should demonstrate that the proposed system can deliver the required light level and uniformity across the actual growing area.
Minimum Light Plan Information
Look for these elements when reviewing a vendor’s proposal:
| Light Plan Element | What It Tells You |
|---|---|
| Fixture model | Exactly which luminaire was simulated |
| Fixture quantity | Total number of fixtures |
| Fixture wattage | Connected lighting load |
| Fixture PPF | Total photon output per fixture |
| Mounting height | Distance from fixture to canopy |
| Fixture spacing | Center to center layout |
| Layout arrangement type | Grid, row, or hybrid pattern |
| Average PPFD | Expected average canopy intensity |
| Minimum PPFD | Lowest predicted intensity |
| Maximum PPFD | Highest predicted intensity |
| Uniformity metric | How evenly light is distributed |
| Growing area | Actual productive footprint being evaluated |
| Simulation grid | Where PPFD calculations were taken |
| Dimming level | Whether fixtures operate at full or reduced output |
| Electrical load | Expected system demand |
| Obstructions | Structural and equipment constraints |
| Natural light assumptions | How sunlight was incorporated |
Questions to Ask a Lighting Vendor
Before approving a greenhouse lighting layout, ask:
- What average PPFD does the simulation predict?
- What are the minimum and maximum PPFD values?
- What uniformity metric are you using?
- What mounting height was modeled?
- What fixture PPF and PPE were used?
- Does the simulation account for greenhouse structure and obstructions?
- How was natural sunlight incorporated?
- What seasonal conditions were used?
- What is the total connected electrical load?
- How will the installed system be verified after commissioning?
- Is the layout a grid, row, or hybrid arrangement, and why was that pattern chosen?
A layout that only shows fixture locations without these performance metrics is difficult to evaluate objectively.
Infrastructure and Electrical Considerations
LED Driver
The component that converts AC building power to the DC voltage and current an LED array requires. Most LED fixtures include their power driver inside the fixture itself. This is simple and works for smaller installations. The downside: every driver generates heat right where you don’t want it, above your canopy. That heat increases HVAC load, reduces fixture lifespan, and adds a failure point in the growing environment.
Remote (Centralized) Power Architecture
Relocating LED drivers outside the growing area changes the install economics, heat profile, and reliability math. Instead of hundreds of individual drivers mounted above the canopy, a centralized system feeds clean power to lightweight, driverless fixtures. This approach reduces above canopy heat (lowering HVAC demand), simplifies maintenance, and can eliminate significant conduit and wiring costs.
The OptiDrive platform is purpose built for this architecture, available in DC and DE configurations for new builds and retrofits respectively.
Electrical Load Calculation
Total power demand of the lighting system, measured in watts or kilowatts, broken down by circuit and panel. Your greenhouse lighting layout directly determines electrical load: fixture count × fixture wattage = total demand, plus losses in drivers and wiring.
Light Pollution
Electric lighting that escapes the greenhouse and affects neighboring areas at night, whether other greenhouse sections, nearby homes, or surrounding communities. Increasingly, municipalities regulate stray light from controlled environment agriculture.
A practical benefit of containment: a light pollution screen’s lower side reflects lamp light back toward the crop, increasing light intensity within the greenhouse by 3 to 5%, which can positively impact crop growth and yield. So light pollution controls aren’t just regulatory compliance; they’re free photons.
Common Greenhouse Lighting Layout Mistakes
These errors show up repeatedly in real facilities. Practitioners on forums and in trade publications report the same patterns.
Hot bands down the center. Fixtures spaced too close together in the middle rows create an intensity stripe with weak edges. Fix: increase center to center spacing in interior rows by 10 to 15% and redistribute fixtures toward the perimeter.
Weak edges and corners. The perimeter is where most layouts fail. Outermost fixtures split the distance to the wall instead of biasing toward the canopy edge. Fix: move perimeter fixtures closer to the growing area boundary rather than centering them between the last row and the wall.
Overestimating winter light transmission. As noted above, assuming 80 to 90% transmission year round when winter reality is 50 to 60% leaves crops 2 to 3 moles short daily, for months. Fix: calculate supplemental lighting requirements using worst case seasonal transmission, not summer noon.
Specifying lighting too late. Design missteps happen when growers finalize lighting after HVAC, energy curtains, and structural supports are already installed. Those systems constrain mounting height, fixture placement, and electrical routing. Fix: bring lighting into the design process from day one.
The bullseye effect. Regularly spaced planar layouts exhibit poor spatial uniformity because interior regions are closer to more luminaires than edge regions. The result is a bullseye pattern where the center is overlit and corners are underlit. Fix: tighten edge spacing, loosen center spacing, and verify with a PPFD grid map.
Choosing grid or row layout without considering crop geometry. One mistake that comes up in practitioner discussions: growers default to a grid arrangement because it “looks right” even when their crops grow in defined rows. The result is wasted photons on aisles and insufficient intensity on crop centers. Fix: let the crop layout and greenhouse structure drive the arrangement pattern, then simulate to confirm.
DLI Targets by Crop: Quick Reference Table
| Crop | DLI Target (mol/m²/day) | Notes |
|---|---|---|
| Leafy greens / lettuce | 12 to 17 | Most varieties perform well across this range |
| Tomatoes | 20 to 35 | Higher DLI drives fruit quality and yield |
| Cannabis (flower) | 35 to 50 | High light crop; CO₂ supplementation often paired |
| Floriculture (shade intolerant) | 10 to 12 minimum | Minimum during finishing for shade intolerant species |
| Low light ornamentals | 3 to 6 | African violets, some orchids, foliage plants |
| Peppers / cucumbers | 15 to 25 | Varies by cultivar and growth stage |
For crop specific lighting requirements, see the detailed guides for tomatoes, lettuce, and peppers.
Emerging Research: DLI Carry Over
One area of active research worth watching: DLI “carry over” between days. Studies have found that DLI requirements can be reduced by approximately 5.25 mol/m²/d on the day following a sunny day. This approach resulted in annual energy savings of approximately 75 to 190 MWh/ha in greenhouse lettuce production.
The implication for greenhouse lighting layout is that future control systems may dynamically adjust supplemental lighting based not just on today’s conditions but on yesterday’s accumulated light. No commercial layout tool accounts for this yet, but it is coming.
Greenhouse Lighting Layout Checklist
Before approving a greenhouse lighting layout, confirm that you have answered each of these questions:
Crop Requirements
- What is the target DLI?
- What supplemental PPFD is required?
- Does the requirement change by growth stage?
- Does each crop zone have its own lighting prescription?
Fixture Selection
- What is the fixture’s PPF?
- What is its PPE?
- What is the beam distribution?
- Is the fixture dimmable?
- Is it suitable for the greenhouse environment?
Layout
- What is the fixture mounting height?
- What is the center to center spacing?
- Is the arrangement a grid, row, or hybrid pattern?
- How are perimeter fixtures positioned?
- Are corners adequately illuminated?
- Are structural shadows accounted for?
Simulation
- What is the predicted average PPFD?
- What are the minimum and maximum PPFD values?
- What uniformity metric is being used?
- What natural light assumptions were included?
Infrastructure
- What is the total electrical load?
- Where are drivers located?
- Does the layout interfere with HVAC or energy curtains?
- Are mounting points and maintenance access adequate?
Commissioning
- Will PPFD be measured after installation?
- Will measurements cover the full productive footprint?
- Will measured values be compared against the original simulation?
If any of these questions cannot be answered, the lighting layout is not yet fully specified.
Plan Your Greenhouse Lighting Layout

Every term in this glossary connects to a decision that affects your crop quality, energy costs, and project ROI. If you are designing a new greenhouse or retrofitting an existing one, getting the layout right at the start prevents expensive corrections later.
Talk to a lighting design expert to translate these metrics into a light plan built for your facility, crops, and climate.
Frequently Asked Questions
What is a greenhouse lighting layout?
A greenhouse lighting layout is the planned arrangement of supplemental light fixtures, specifying their type, quantity, spacing, mounting height, and orientation, designed to deliver a target PPFD uniformly across the growing area. It accounts for natural sunlight, greenhouse structure, and crop specific light requirements.
How do I determine how many fixtures my greenhouse needs?
Start with your crop’s DLI target. Subtract the natural light your greenhouse provides (accounting for seasonal variation and glazing transmission). The remaining DLI deficit, combined with your planned photoperiod, gives you the required supplemental PPFD. Divide by each fixture’s output at your mounting height, and you have your fixture count.
What PPFD uniformity should I target?
Industry standard is ±10 to 15% of the mean PPFD, with a coefficient of variation below 15%. Some high value crops and precision operations target ±5%. Uniformity matters as much as intensity for consistent harvests.
Does mounting height really matter that much?
Yes. A 5 cm change in mounting height at typical greenhouse distances can alter PPFD by 20 to 30%. Even small deviations from the design specification cause measurable performance gaps, particularly in multi tier and low ceiling applications.
Should I use a grid layout or a row layout?
Grid layouts deliver higher two dimensional uniformity and work best for open, flat canopies like lettuce or cannabis sea of green. Row layouts align naturally with gutter connected greenhouse bays and linear crop geometries like tomatoes and cucumbers, and they simplify wiring and installation. Many commercial operations use a hybrid, with row mounted toplights and grid positioned interlighting. Let the crop geometry and greenhouse structure guide the choice, then simulate to verify uniformity.
Should I use toplighting, interlighting, or under canopy lighting?
It depends on the crop. Most greenhouse layouts start with toplighting. For tall, vining crops like tomatoes, interlighting reaches shaded lower leaves that toplighting cannot. Under canopy lighting has shown yield increases of nearly 30% in cannabis trials. Many commercial operations combine two or all three strategies.
When in the design process should I plan lighting?
Before HVAC, energy curtains, and structural supports are finalized. Lighting affects and is constrained by all three. Specifying lighting last is one of the most common and costly mistakes in greenhouse construction.
What is design to install variance?
It is the gap between what a light plan’s software simulation predicts and what the installed system actually delivers at the canopy. Ask any vendor for their published variance number. Tighter variance (±5% or better) means fewer post install surprises.
How does greenhouse orientation affect my lighting layout?
Gutter connected greenhouses should be oriented north/south to minimize truss shadows. Free standing greenhouses above 40°N latitude benefit from east/west orientation for maximum winter light. Orientation determines where natural light is strongest and weakest, which directly shapes where supplemental fixtures need to compensate.