PPF vs PPFD: What They Mean and When It Matters (2026)
Learn PPF vs PPFD in plain terms: PPF (µmol/s) vs PPFD (µmol/m²/s), how to measure each, and when to use them. Get pro tips and formulas inside.
TL;DR
PPF (Photosynthetic Photon Flux) measures the total number of photosynthetically active photons a grow light emits per second, expressed in µmol/s. PPFD (Photosynthetic Photon Flux Density) measures how many of those photons actually land on a specific area of your canopy, expressed in µmol/m²/s. PPF is a fixture-level spec measured in a lab. PPFD is a canopy-level reading you can take yourself with a PAR meter. You need both metrics to make smart lighting decisions: PPF to compare fixtures and size your layout, PPFD to verify that your plants are getting the right amount of light.
Understanding the difference between PPF and PPFD is one of the most practical things a grower can learn before investing in lighting. These two metrics show up on every spec sheet, in every lighting design conversation, and in most grow-room troubleshooting sessions. Yet they measure fundamentally different things, and confusing them leads to bad purchasing decisions, uneven canopies, and wasted electricity.
If you’re planning a new build or evaluating fixtures for an upgrade, talk to a lighting expert before committing to spec sheets alone.
What Is PPF?
PPF stands for Photosynthetic Photon Flux. It measures the total number of photosynthetically active photons (wavelengths between 400 and 700 nm) that a light fixture emits every second. The unit is micromoles per second (µmol/s).
Think of PPF as the fixture’s total output, everything it produces, in every direction, regardless of where those photons end up. A fixture with a PPF of 2,100 µmol/s is producing 2,100 micromoles of usable photons each second. That number says nothing about how many of those photons reach your plants.
How it’s measured: PPF requires an integrating sphere, a specialized piece of lab equipment that captures light from every direction simultaneously. The fixture sits inside a hollow sphere coated with a highly reflective, diffusive material, and a detector tallies the total photon output. This is not something growers or most researchers can do themselves. It’s a manufacturer or third-party lab measurement.
What it tells you: PPF is the right metric for comparing the raw output of one fixture against another. It’s also the starting point for calculating efficiency (more on that below). When you’re sizing a lighting layout, asking “how many fixtures do I need for this footprint,” PPF is the number that drives the answer.
What it doesn’t tell you: PPF says nothing about what actually reaches your canopy. Photons scatter, reflect off walls, get absorbed by structure, and diminish with distance. Independent testing by Coco for Cannabis has found that reported PPF figures are typically almost 20% higher than independently measured values, and that even in ideal conditions, 10 to 15% of a fixture’s photons never reach plants.
What Is PPFD?
PPFD stands for Photosynthetic Photon Flux Density. It measures the number of photosynthetically active photons arriving at a specific point on your canopy each second, per square meter. The unit is micromoles per square meter per second (µmol/m²/s).
Where PPF describes what the fixture produces, PPFD describes what the plant receives. It is a spot measurement, a reading at one location, at one height, at one moment.
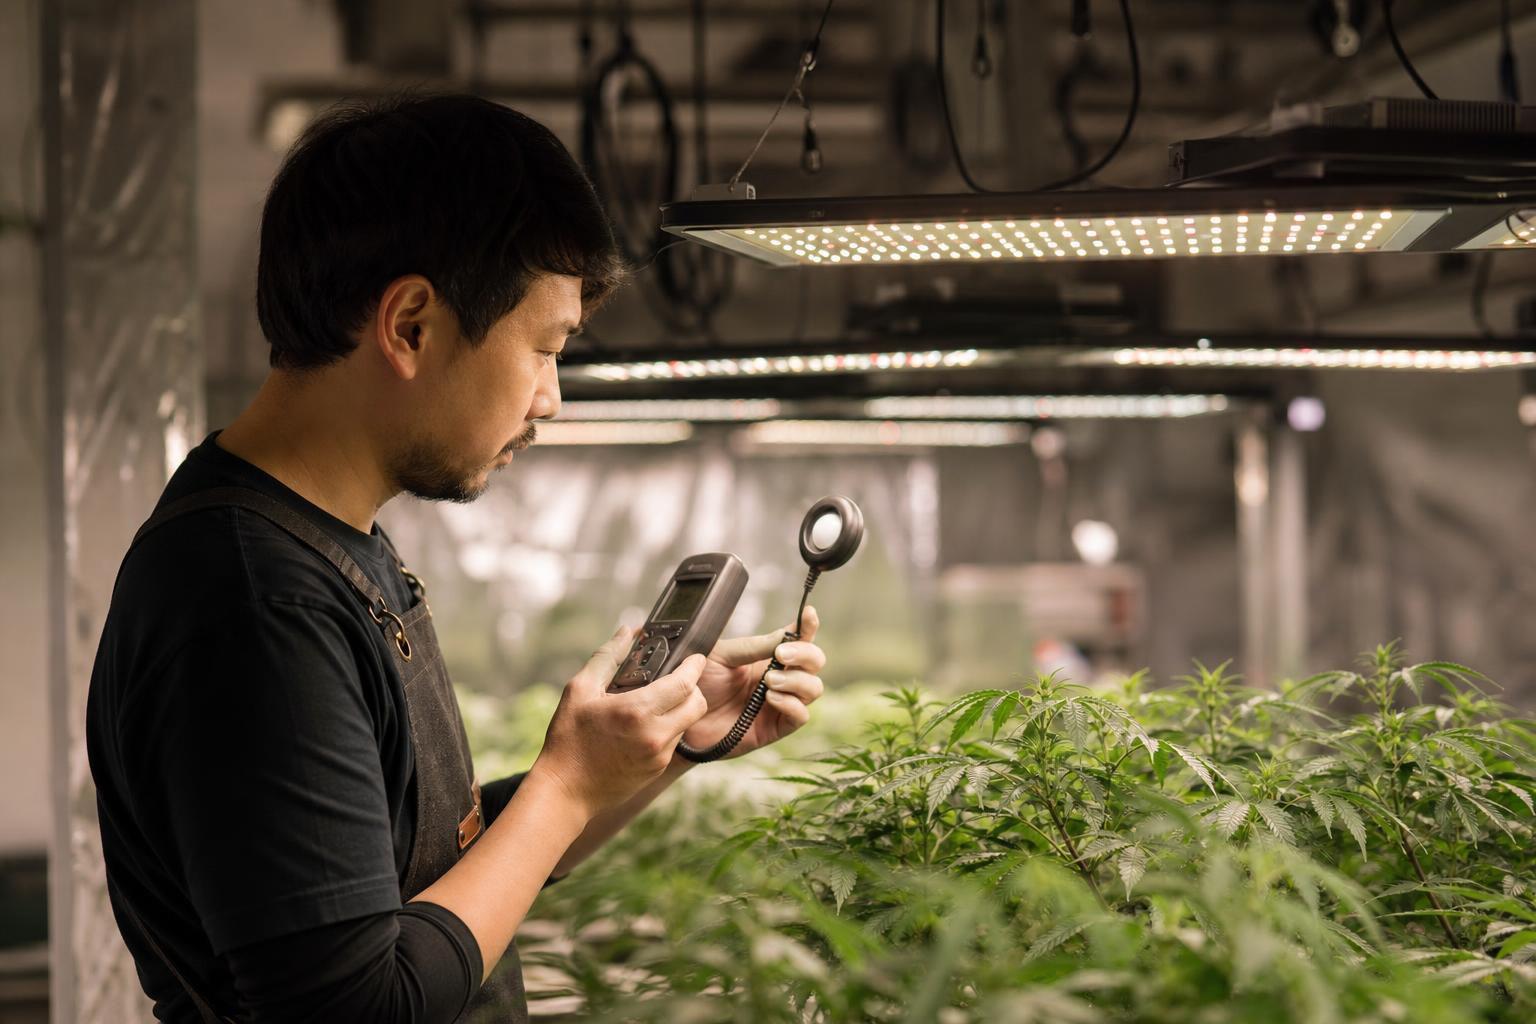
How it’s measured: A handheld quantum sensor or PAR meter placed at canopy level. Unlike PPF, any grower can measure PPFD with relatively affordable equipment. To get a meaningful picture, you need multiple readings across a grid, not just one reading at the center of your footprint.
What it tells you: PPFD is how you verify canopy conditions. It tells you whether your plants are getting enough light, whether your coverage is uniform, and whether your hanging height is correct. It’s also the input for calculating DLI (Daily Light Integral), the total daily light budget your plants receive.
What it doesn’t tell you: A single PPFD reading can be deeply misleading. Horticulture lights are generally brightest at the center, with intensity dropping significantly toward the edges. A headline PPFD number without a reference height and a full coverage map is incomplete at best, deceptive at worst.
PPF vs PPFD: Side-by-Side Comparison
Here’s a clean breakdown of how these two metrics differ:
| PPF | PPFD | |
|---|---|---|
| Full name | Photosynthetic Photon Flux | Photosynthetic Photon Flux Density |
| Unit | µmol/s | µmol/m²/s |
| What it measures | Total photon output of a fixture | Photons arriving at a specific area |
| Human-lighting equivalent | Lumens (total light output) | Lux (light at a surface) |
| How measured | Integrating sphere (lab) | Quantum sensor / PAR meter (field) |
| Who can measure it | Manufacturers, testing labs | Growers, consultants, anyone with a PAR meter |
| Best use | Comparing fixtures, calculating efficiency, sizing layouts | Verifying canopy intensity, mapping uniformity, calculating DLI |
| Key limitation | Doesn’t tell you what reaches the plant | Single-point reading can mislead without grid average and height context |
The Garden Hose Analogy
The analogy that shows up across educational sources and grower forums works well here:
PPF is the total water flowing from a garden hose, measured in gallons per minute. It tells you the source’s capacity but nothing about where the water lands.
PPFD is the water hitting one specific square foot of your lawn, measured in gallons per minute per square foot. It tells you what a particular spot actually receives.
This is why PPF is sometimes called “the promise” and PPFD is “the proof.” PPF lives on the spec sheet. PPFD is what you measure in the room.
For a deeper dive into how PAR relates to both metrics, see our PAR vs PPFD explainer.
Where PAR, PPE, and DLI Fit In
PPF and PPFD don’t exist in isolation. They sit within a family of metrics that together describe how light reaches and feeds your plants.
PAR Is a Wavelength Range, Not a Measurement
A common source of confusion: PAR (Photosynthetically Active Radiation) is not a number you read off a meter. It defines the wavelength band from 400 to 700 nm, the portion of the light spectrum that drives photosynthesis. PPF and PPFD are both measurements within the PAR range. Spectrum choices within that range also matter for plant morphology and chemistry, which is why light spectrum affects plant growth in ways that go beyond raw intensity.
PPE Connects PPF to Your Electricity Bill
PPE (Photosynthetic Photon Efficacy) answers the question: how efficiently does this fixture convert electricity into usable photons?
The formula is simple: PPE = PPF ÷ Input Wattage, expressed in µmol/J (micromoles per joule).
Benchmarks have shifted dramatically in recent years. A 400W single-ended HPS lamp delivers roughly 0.9 µmol/J, while a double-ended 1,000W HPS reaches about 1.7 µmol/J. Modern LED fixtures vary widely, with top performers nearing 3.0 µmol/J. That efficiency gap is why the LED vs HPS comparison keeps coming up in facility planning. PPE also directly affects heat load and HVAC sizing, since less efficient fixtures waste more energy as heat.
DLI Turns PPFD Into a Daily Light Budget
DLI (Daily Light Integral) is the total number of photons per square meter that your plants receive over an entire day. It’s the metric commercial growers actually plan around.
DLI = PPFD × photoperiod hours × 0.0036
For example, a PPFD of 300 µmol/m²/s with 16 hours of light produces a DLI of 17.28 mol/m²/day. Our PPFD vs DLI guide walks through this calculation with crop-specific targets.
How to Use PPF and PPFD When Evaluating Grow Lights
Understanding the definitions is step one. Applying them to purchasing and facility decisions is where the real value sits.
Use PPF to Compare Fixtures and Size Your Layout
PPF is your apples-to-apples comparison metric. When two fixtures claim to cover the same area, the one with higher PPF produces more photons. But raw PPF alone doesn’t tell the full story. You also need to consider efficiency (PPE) and optical distribution.
For layout planning, the basic formula is:
Fixtures needed = (Target PPFD × grow area in m²) ÷ (PPF per fixture × canopy utilization factor)
The canopy utilization factor accounts for photon losses from spacing, wall absorption, and fixture geometry. Typical values range from 0.7 to 0.9 depending on room design. Our greenhouse PPFD calculator walks through this in detail.
For commercial cannabis or greenhouse projects, view full product spec sheets to get verified PPF and PPE data before running your numbers.
Use PPFD to Verify What’s Actually Happening at the Canopy
Once fixtures are installed, PPFD is what you measure to confirm the design is performing. Take readings across a grid pattern at canopy height, not just at the center.
Practitioners on Reddit and grow forums regularly report that uniformity problems cause more yield issues than raw intensity shortfalls. A powerful fixture with poor optical distribution can create aggressive center intensity and weak perimeter performance, leaving edge plants underlit while center plants risk light stress.
Watch for Misleading PPFD Claims
Three specific traps to watch for:
Center-point PPFD. A single reading taken at the brightest spot beneath a fixture tells you almost nothing about real coverage. Lighting companies that only publish center-point PPFD grossly overestimate the true light intensity across the actual grow area.
Reflective-tent maps. Many manufacturers present PPFD maps based on measurements in empty reflective tents. The reflective walls bounce photons back into the measurement plane, inflating the numbers. In an actual grow setup with plant canopies and containers, those reflections don’t exist the same way.
Reported vs. actual PPF. As noted earlier, independent testing consistently shows that manufacturer-reported PPF runs roughly 20% above independently verified values. A horticulture lighting facts label standard would help, but until that’s universal, independent verification matters.
PPFD Is Three-Dimensional in Dense Canopies
Most lighting discussions treat PPFD as a flat-plane measurement at the top of the canopy. In reality, light needs to penetrate into the canopy, reaching middle and lower nodes that contribute to yield. This is especially true in cannabis cultivation, where lower flower sites can account for significant production.
This is why under-canopy lighting has become a serious strategy for commercial operations, adding light below the canopy rather than simply increasing intensity from above.
The Inverse Square Law Creates the Gap
The physical reason PPF and PPFD diverge so sharply is the inverse square law. Doubling the distance between a fixture and the canopy reduces PPFD by approximately 75%. This is why hanging height matters so much, and why a PPFD reading without a reference distance is meaningless.
Quick-Reference PPFD Targets by Crop and Stage
| Growth Stage / Crop | Target PPFD (µmol/m²/s) |
|---|---|
| Seedlings / clones | 100 to 300 |
| Vegetative growth (cannabis) | 300 to 600 |
| Flowering (cannabis) | 600 to 1,000+ |
| Leafy greens (lettuce, herbs) | 250 to 350 |
Research published in Frontiers in Plant Science found that dry cannabis inflorescence yield increased linearly with PPFD up to 1,800 µmol/m²/s, though leaf-level photosynthesis saturated well below that threshold. Pushing PPFD that high only works when CO₂ supplementation, VPD, and nutrition are all dialed in to match.
For crop-specific lighting targets, our cannabis PPFD guide breaks down each growth stage in detail.
One common mistake is providing too much light, thinking more PPFD is always better. Without the environmental conditions to support high intensity, excess light leads to light burn, bleached leaves, and wasted electricity.
Putting It All Together
PPF and PPFD are not competing metrics. They answer different questions at different stages of the lighting decision process.
Before you buy, compare PPF and PPE across fixtures to find the best combination of output and efficiency. During layout planning, use PPF to calculate how many fixtures you need. After installation, use PPFD to verify uniformity, confirm hanging heights, and calculate DLI for your crop targets. Over time, use PPFD readings to catch degradation, adjust photoperiods, and optimize environmental conditions alongside light intensity.
The gap between what a fixture produces (PPF) and what your canopy receives (PPFD) is where lighting design lives. Closing that gap is the difference between a spec sheet and a harvest.
Ready to match these metrics to your facility? Schedule a free consultation with a lighting expert.
Frequently Asked Questions
Can I measure PPF myself?
No. PPF requires an integrating sphere, which is expensive, specialized lab equipment. Manufacturers and independent testing labs measure PPF. As a grower, you can measure PPFD with a handheld PAR meter, but fixture-level PPF comes from the manufacturer’s published data or third-party lab reports.
Is a higher PPF always better?
Not necessarily. A fixture with high PPF but poor optical distribution might concentrate photons in a narrow area, creating hot spots and weak edges. PPF tells you total output. You still need to evaluate the PPFD map and coverage uniformity for your specific room dimensions.
Why do some spec sheets show PPFD instead of PPF?
PPFD is easier to make look impressive, especially if the reading comes from a single center point or a reflective test environment. Always check whether a published PPFD value includes the measurement height, the coverage area, and whether it represents a grid average or just the peak center reading.
How do PPF and PPFD relate to DLI?
PPF does not directly connect to DLI. PPFD does. DLI is calculated by multiplying your average PPFD by the number of hours your lights are on, then multiplying by 0.0036. DLI gives you the total daily light budget your plants receive and is the metric most useful for crop planning.
What’s a good PPE for LED grow lights?
Modern commercial LEDs range widely in PPE. Top performers are approaching 3.0 µmol/J. As a general benchmark, anything above 2.0 µmol/J is competitive for commercial applications. Legacy HPS fixtures typically fall between 0.9 and 1.7 µmol/J depending on the lamp type.
Does hanging height affect PPF or PPFD?
Hanging height does not change PPF. The fixture produces the same total photon output regardless of where it’s mounted. Hanging height dramatically affects PPFD because of the inverse square law. Doubling the distance between fixture and canopy reduces the photon density reaching the canopy by roughly 75%.
Why is PPFD uniformity important?
Because plants at the edges of your coverage area receive less light than plants directly beneath the fixture. If your layout only delivers good PPFD at the center, edge plants will underperform. Uniformity, the ratio between minimum and average PPFD across your grow area, is often more important than peak intensity for consistent yields.
Should I trust manufacturer PPFD maps?
Treat them as a starting point, not gospel. Independent testing frequently shows that reported values run higher than real-world performance. Ask whether maps were generated in a reflective enclosure, whether they represent a grid average, and at what height the measurements were taken. When possible, verify with your own PAR meter after installation.