PAR vs PPFD Explained (2026): What Growers Need to Know
Understand PAR vs PPFD: clear definitions, canopy examples, and how PPFD, PPF, PPE, and DLI improve yields. See targets and get pro tips.
TLDR
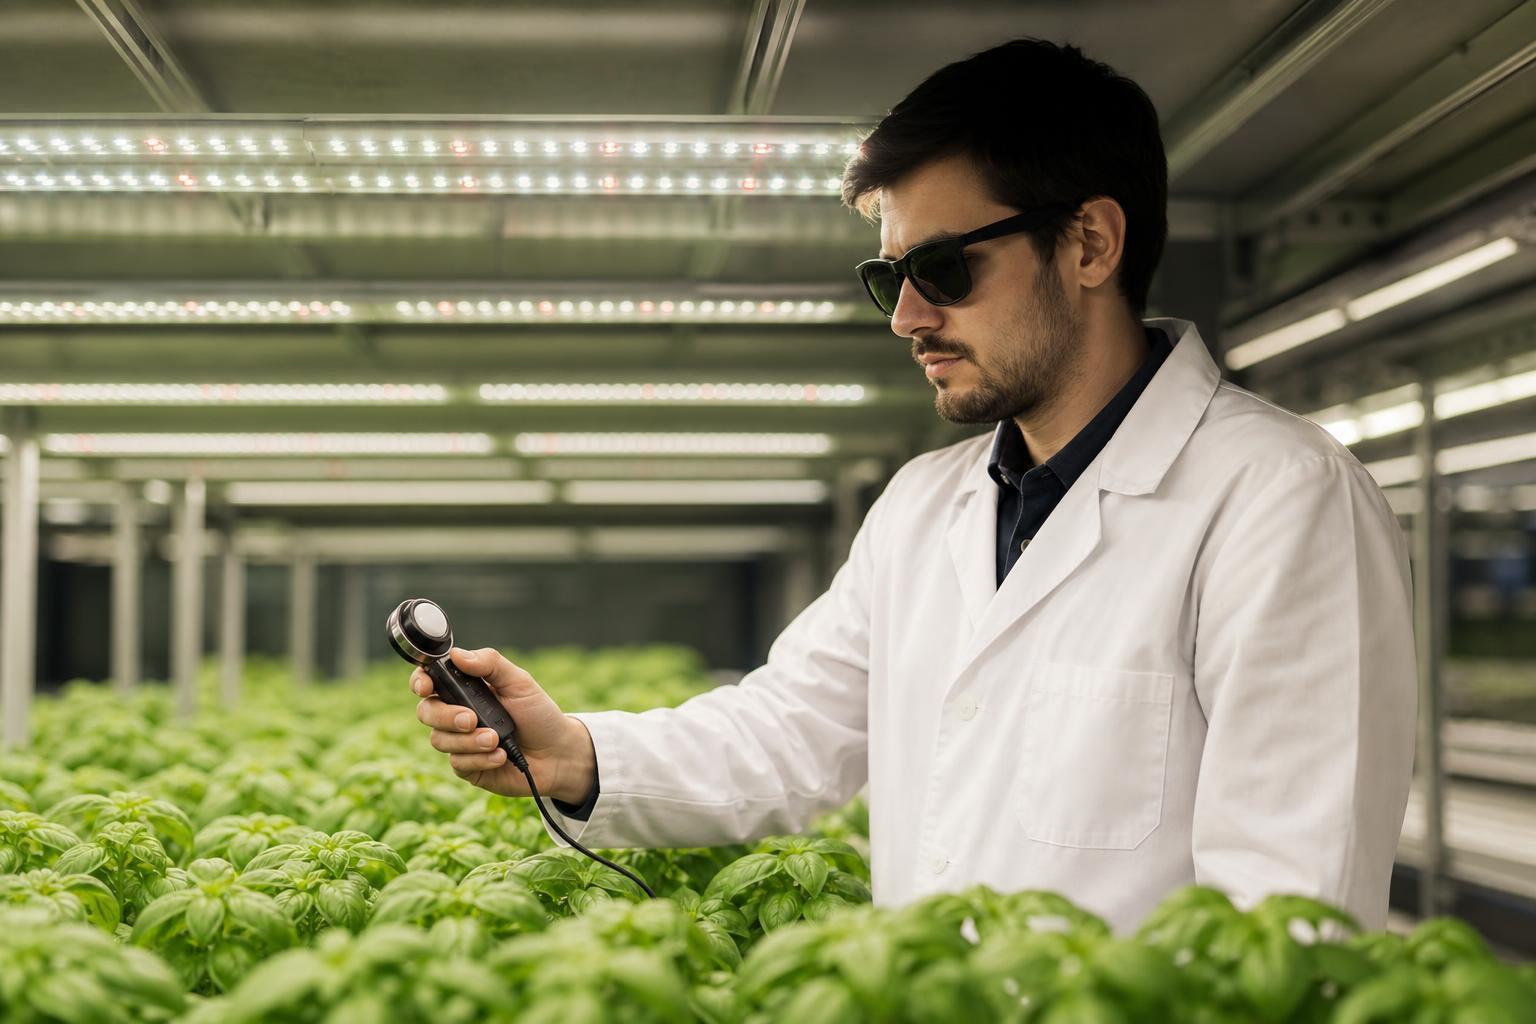
PAR (photosynthetically active radiation) is the 400 to 700 nm wavelength range that plants use for photosynthesis. PPFD (photosynthetic photon flux density) measures how many of those plant-usable photons reach one square meter of canopy each second, reported in µmol/m²/s. PAR defines what light counts. PPFD tells you how much of it actually reaches the crop.
PAR vs PPFD: The Quick Answer
PAR and PPFD are related but different. PAR describes the 400–700 nm range of wavelengths used to define photosynthetically active radiation, while PPFD measures the number of photons within that range reaching a specific surface each second. PAR describes the light category; PPFD tells growers how much usable light reaches the canopy, measured in µmol/m²/s.
What Is PAR?
PAR stands for photosynthetically active radiation. The Illuminating Engineering Society defines it as the 400 to 700 nm spectral range used by photosynthetic organisms. That range covers most visible light, from deep blue through green, yellow, orange, and red.
PAR is not a number you read on a meter. It is a definition of which wavelengths count. Think of it as a filter: any photon between 400 and 700 nm passes through; anything outside that range does not get counted toward photosynthetic light delivery.
This matters because not all light is useful to plants. A lamp can look blindingly bright to human eyes but emit most of its energy outside the PAR range. PAR is the starting point for every other plant-light metric.
What Is PPFD?
PPFD stands for photosynthetic photon flux density. Iowa State Extension defines it as the amount of PAR light reaching a given surface area, measured in µmol/m²/s (micromoles of photons per square meter per second).
Where PAR describes the type of light, PPFD describes the quantity at a specific point. A PPFD reading of 600 µmol/m²/s means 600 micromoles of plant-usable photons are hitting each square meter of canopy every second. For a deeper look at what a micromole actually represents, see this explanation of the micromole unit.
PPFD changes with fixture distance, optics, dimming level, reflective surfaces, and overlap from neighboring fixtures. That is why it needs to be measured at the actual crop plane, not assumed from a spec sheet.
PAR vs PPFD at a Glance
Metric | What it describes | Unit | What growers use it for |
|---|---|---|---|
PAR | The traditional 400–700 nm photosynthetically active radiation range | nm | Defines which wavelengths are included |
PPFD | Photon flux density within the PAR range reaching a surface | µmol/m²/s | Setting and measuring canopy light intensity |
PPF | Total photon flux produced by a fixture within the PAR range | µmol/s | Comparing total fixture output |
PPE | Photon output produced per unit of electrical energy | µmol/J | Comparing lighting efficiency |
DLI | Total PAR photon delivery received over a 24-hour period | mol/m²/day | Evaluating daily crop light exposure |
Simple way to remember it: PAR defines the wavelength range, PPF describes what the fixture emits, PPFD describes what reaches the crop, PPE describes electrical efficiency, and DLI describes the total daily light dose.
PAR is the waveband. PPFD is the canopy-level measurement within that waveband.
Growers often say “check your PAR” or “my PAR reading is 800.” In almost every case, they mean PPFD. A “PAR meter” is technically a quantum sensor that reports PPFD. Apogee Instruments describes its quantum sensors as tools for measuring PPFD from 400 to 700 nm under various light sources. The casual shorthand is understandable, but the distinction matters when reading spec sheets or comparing fixtures.
Practitioners on Reddit make this correction regularly. In one r/macrogrowery discussion, an experienced grower explained that PAR is a term for the spectrum while PPFD measures the amount of PAR arriving at the plant.
Which Metric Should Growers Use: PAR, PPFD, PPF, PPE or DLI?
The right metric depends on the question you are trying to answer.
Question | Metric to use |
|---|---|
What wavelength range is being measured? | PAR |
How much light does the fixture produce? | PPF |
How much light reaches my plants? | PPFD |
How evenly is light distributed across the canopy? | PPFD map |
How efficient is the fixture? | PPE |
How much light does the crop receive each day? | DLI |
Should I raise or lower the fixture? | PPFD |
Should I change the photoperiod? | DLI + PPFD |
Which commercial fixture is more electrically efficient? | PPE |
Does my greenhouse need supplemental lighting? | DLI + PPFD |
The practical rule
If you are standing in the grow room and making an adjustment, PPFD is usually the most useful measurement.
If you are comparing fixtures before purchasing, look at PPF, PPE, spectrum, and the manufacturer's PPFD map.
If you are managing crop light over an entire day, use DLI.
If you are evaluating spectral coverage, look at PAR/ePAR and the fixture's spectral power distribution.
How PAR, PPF, PPFD, PPE and DLI Connect
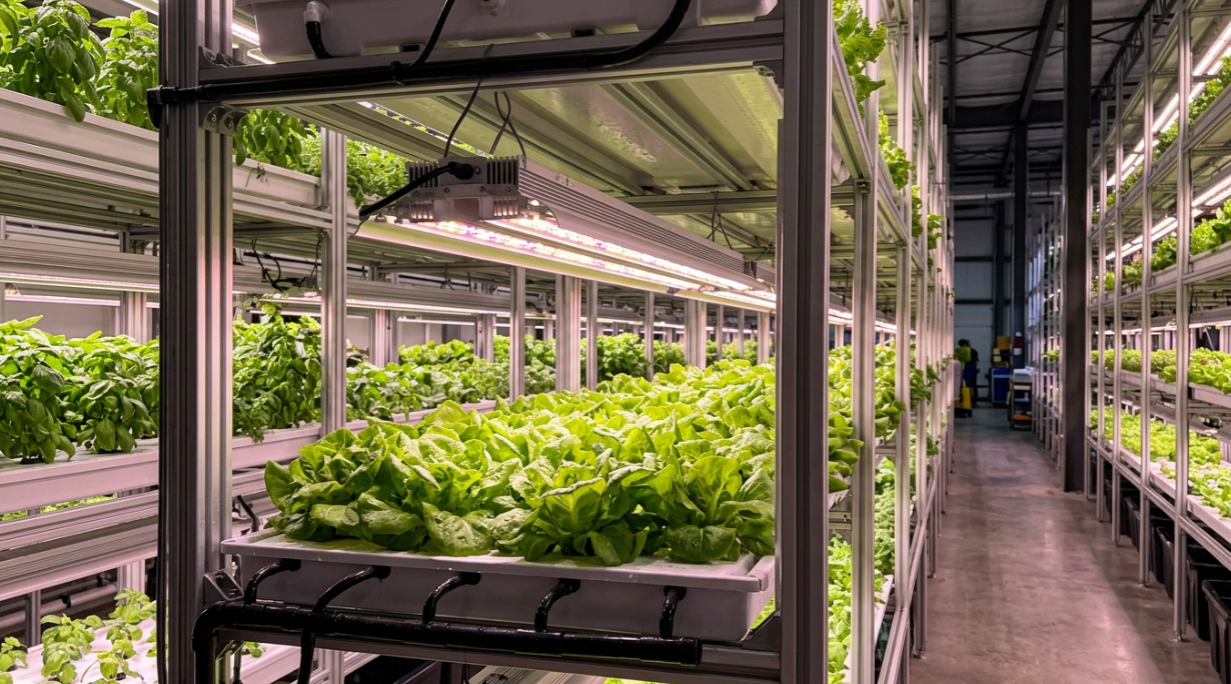
Think of horticultural lighting as a chain:
PAR → PPF → PPFD → DLI
PAR: Which wavelengths are being counted?
PPF: How many PAR photons does the fixture produce?
PPFD: How many of those photons reach the crop surface?
DLI: How many photons reach the crop over the entire day?
PPE: How efficiently does the fixture convert electricity into PAR photons?
For example, a fixture may produce a high PPF but still deliver poor canopy PPFD if it is mounted incorrectly or spaced poorly. Conversely, a fixture with lower total PPF can produce useful canopy PPFD when the fixture layout and mounting height are optimized.
That is why growers should not evaluate a commercial grow light from a single specification such as wattage or PPF. The actual crop-plane PPFD distribution is what connects fixture output to plant exposure.
Where PPF and PPE Fit In
Once you understand PAR vs PPFD, two related metrics become easy to place.
PPF (photosynthetic photon flux) is the total number of PAR photons a fixture emits per second, measured in µmol/s. Iowa State Extension describes PPF as the amount of useful light provided by a source, and it is the number manufacturers list on spec sheets.
PPE (photosynthetic photon efficacy) measures how efficiently a fixture converts electricity into those photons, reported in µmol/J. The DesignLights Consortium uses PPE as a core metric in its horticultural lighting requirements.
A sprinkler analogy works well here. PPF is the total gallons per minute coming out of the sprinkler. PPFD is how much water lands on each square foot of garden bed. PPE is how efficiently the pump moves water per unit of energy.
For commercial buyers, PPF and PPE help compare fixture output and operating cost. PPFD tells you whether that output reaches the crop where it matters.
Why a Grow Light Does Not Have One Fixed PPFD
A grow light does not have one universal PPFD value.
PPFD depends on where the measurement is taken. Fixture height, dimming level, beam angle, optics, spacing, canopy area, reflective surfaces, and the number of fixtures all affect the PPFD reaching the crop.
That means a specification such as “maximum PPFD” is not enough to evaluate a lighting system.
When comparing fixtures, look for a PPFD map that identifies:
Measurement height
Fixture spacing
Dimming level
Growing area
Average PPFD
Minimum PPFD
Maximum PPFD
Uniformity
A fixture's PPF tells you how many photons it produces. A PPFD map shows how those photons are distributed over the growing area.
For commercial applications, the second piece of information can be just as important as the first because uneven light can create different growing conditions across the same canopy. Resource Innovation Institute guidance specifically emphasizes fixture spacing and mounting height as major factors affecting PPFD uniformity.
Why PPFD Matters More for Everyday Grow Decisions
PAR vs PPFD comes down to this: PAR tells you what light counts, but PPFD is the metric you act on.
Every grow-room decision involves PPFD. Should the lights go higher? Check PPFD. Should you dim during propagation? Check PPFD. Are the edges of the canopy too dark? Map PPFD. Should you add supplemental light in a greenhouse? Calculate your PPFD gap.
The Resource Innovation Institute emphasizes that uniformity depends on fixture spacing and mounting height, and that low uniformity can create crop cultivation issues, variable water and nutrient uptake, and inconsistent yields.
A single high PPFD reading at canopy center can hide weak edges and hotspots. Do not ask only for the highest number. Ask for average, minimum, maximum, measurement height, fixture spacing, and a full PPFD map.
Grower communities reinforce this. In an r/GrowBuddy thread, one practitioner described PPFD mapping as a way to eliminate guesswork, adjusting plant placement, dimming, or hang height to achieve a more even canopy.
For crops where lower-canopy light penetration matters (like cannabis flower), under-canopy lighting adds PPFD below the top canopy rather than simply cranking top-light intensity. The research on under-canopy lighting results shows meaningful yield gains from this approach.
How PPFD Connects to DLI
PPFD is an instantaneous rate. It tells you what is happening right now. But plants do not care only about this second. They accumulate light over the full photoperiod, and that daily total is called DLI (daily light integral), measured in mol/m²/day.
Virginia Cooperative Extension provides the standard DLI formula:
DLI = PPFD × 3,600 × hours ÷ 1,000,000
Or the simplified version:
DLI = PPFD × hours × 0.0036
This formula changes how you think about PAR vs PPFD in practice. PPFD is the speed of photon delivery. DLI is the total daily shipment.
DLI examples
PPFD (µmol/m²/s) | Photoperiod (hours) | DLI (mol/m²/day) |
|---|---|---|
200 | 16 | 11.5 |
300 | 18 | 19.4 |
600 | 12 | 25.9 |
800 | 12 | 34.6 |
600 | 18 | 38.9 |
1,000 | 12 | 43.2 |
Notice that 600 µmol/m²/s for 18 hours delivers a higher DLI than 800 µmol/m²/s for 12 hours. This matters enormously for crops that tolerate longer photoperiods. Cannabis growers face this directly when switching from 18-hour vegetative schedules to 12-hour flower. Cutting hours reduces DLI unless intensity increases to compensate.
Community discussions on Reddit confirm this is a common realization. One cannabis cultivation thread walks through the DLI formula and explains that growers need to bump PPFD when they flip to flower to avoid losing daily light dose.
For detailed DLI calculations and crop targets, the DLI greenhouse guide covers the math in depth.
In advanced commercial facilities, practitioners on LinkedIn report that dynamic lighting strategies can preserve DLI while shifting intensity to cheaper electricity windows, with some operations reporting up to 38% electricity cost reduction by redistributing light delivery across the day.
How to Read a Grow Light Spec Sheet
Specification | What it tells you | What to look for |
|---|---|---|
Wattage | Electrical consumption | Do not use it as a proxy for light output |
PPF | Total photon output | µmol/s |
PPE | Photon efficiency | µmol/J |
PPFD map | Light reaching canopy | Average, minimum, maximum |
Uniformity | Consistency across canopy | Higher is generally preferable |
Spectrum | Wavelength distribution | Check actual spectral graph |
Mounting height | Distance used for PPFD map | Must match your installation |
Dimming | Ability to control output | Useful for crop-stage management |
Warranty/lifetime | Expected service life | Important for commercial TCO |
Iowa State specifically notes that watts are not a reliable indication of plant-light intensity, while PPF is a more direct plant-light metric.
Why Lux, Lumens, and Watts Fall Short
When comparing PAR vs PPFD to other light metrics, the distinction becomes clear fast.
Lux and lumens measure light as perceived by the human eye. Iowa State Extension explains that lux and foot-candles are based on lumens, which describe human visual brightness rather than plant-useful light. Virginia Tech’s DLI guide goes further, stating that candela, lumen, foot-candles, lux, watts, and joules are not recommended for measuring plant light levels.
A green LED and a red LED could produce identical lux readings but wildly different photosynthetic responses. The human eye is most sensitive to green light, so lux overweights green and underweights the deep blue and deep red wavelengths that drive photosynthesis efficiently.
Watts measure energy consumed by the fixture. They say nothing about how much PAR the fixture emits or how evenly that light reaches the crop. Two fixtures pulling the same wattage can deliver very different PPFD at the canopy. This is one of the most common mistakes when comparing lighting technologies.
Can you convert lux to PPFD? Only approximately, and only if you know the exact spectrum. Apogee’s PPFD-to-lux guidance notes that conversion varies under different light sources. There is no universal multiplier. Practitioners on Reddit echo this point, with one r/microgrowery user warning that lux-to-PPFD conversion is spectrum-dependent and should not be trusted across all fixtures.
Do not compare commercial grow lights by wattage alone. Compare canopy PPFD, uniformity, PPF, PPE, mounting height, spectrum, and total operating cost.
How to Measure PPFD
Understanding PAR vs PPFD conceptually is one thing. Getting accurate readings is another, and this is where many growers struggle.
Choose the right tool
For commercial operations, use a calibrated quantum sensor. The Resource Innovation Institute recommends measuring average canopy PPFD with a calibrated PAR quantum meter after fixtures are installed. Apogee notes that original-generation quantum sensors can have significant errors under LED fixtures, especially those with heavy blue/red spectra, and recommends full-spectrum sensors for LED applications.
For home growers, phone apps can be better than guessing. But multiple Reddit threads show growers reporting inconsistent readings between phone models and warning that apps should not be treated as perfectly accurate. One r/microgrowery user preferred a dedicated PPFD meter for repeatability after getting inconsistent phone readings.
Measure at the crop plane, not at the fixture
PPFD changes with distance, angle, and reflective surroundings. Always measure at actual canopy height.
Use a grid
A single center reading can make a lighting layout look stronger than it is. Record measurements across a grid and note:
Fixture model and configuration
Mounting height and dimming percentage
Sensor type
Grid spacing and canopy height
Average, minimum, and maximum PPFD
Date, time, and sky conditions (for greenhouses)
Convert to DLI
After mapping PPFD, multiply by photoperiod using the formula above. This bridges the gap between instantaneous intensity and daily crop light dose.
Adjust incrementally
The Resource Innovation Institute recommends a “tweak and peek” approach when making lighting changes, because lighting interacts with watering, fertilizing, CO₂, temperature, and humidity. Change one or two variables at a time.
What PPFD Should You Target?
There is no single correct PPFD for all crops and stages. The right target depends on crop species, growth stage, photoperiod, CO₂ level, temperature, humidity, and production goals.
Virginia Tech provides example DLI ranges that help frame realistic targets:
Crop or stage | Example DLI range (mol/m²/day) | Note |
|---|---|---|
Seedlings | 5–10 | Avoid pushing intensity too early |
Cuttings | 5–10 | Lower DLI supports rooting without stress |
Microgreens | 9–12 | Short crop cycles make consistency important |
Lettuce | 12–17 | Often managed by DLI more than peak PPFD |
Spinach | 14–20 | Higher target than many seedlings |
Parsley | 10–15 | Useful herb example |
To convert a DLI target into a PPFD target, divide by photoperiod hours and by 0.0036. For example, if lettuce needs 15 mol/m²/day and runs a 16-hour photoperiod:
PPFD = 15 ÷ 16 ÷ 0.0036 = roughly 260 µmol/m²/s
For cannabis, published research has tested flowering PPFD levels ranging from 120 to 1,800 µmol/m²/s, examining the relationships among light intensity, photosynthesis, and yield. Higher PPFD only pays off when the crop, CO₂ supply, temperature, humidity, irrigation, nutrition, and airflow can support the higher photon load. The cannabis PPFD target guide covers stage-specific recommendations in detail.
Greenhouse vs Indoor: How Context Changes Everything
Greenhouses
In a greenhouse, the sun provides a large portion of daily PAR. Fixtures supply the rest. Virginia Tech notes that greenhouses typically receive 30% to 50% less light than open fields because of glazing and structural losses.
Greenhouse lighting should be planned around the lowest-light period of the year, usually December in the Northern Hemisphere, because that minimum DLI determines supplemental lighting needs. The process is straightforward: measure inside-greenhouse DLI, subtract from the crop target, then calculate how much supplemental PPFD and runtime are needed to fill the gap.
For a deeper walkthrough of greenhouse-specific light levels and seasonal planning, see the greenhouse light levels guide.
Indoor and vertical farms
Indoor grows depend entirely on electric lighting. Fixture layout, canopy height, dimming, photoperiod, and uniformity become the whole picture. The Resource Innovation Institute recommends that vertical growers consistently measure light levels and record trends over time, because fixture depreciation is not detectable by the eye. Growers may need to replace fixtures after a 6 to 10% PPFD depreciation if yield differences become noticeable.
The right question for indoor operations is not “What is the fixture’s PPFD?” It is “What is the average, minimum, maximum, and uniformity at the actual crop plane, under the real mounting height and dimming setting?”
For operations where lower-canopy light matters, under-canopy fixtures like the Boost XE add photons below the top canopy rather than just increasing top-light intensity.
Advanced Note: ePAR and Far-Red
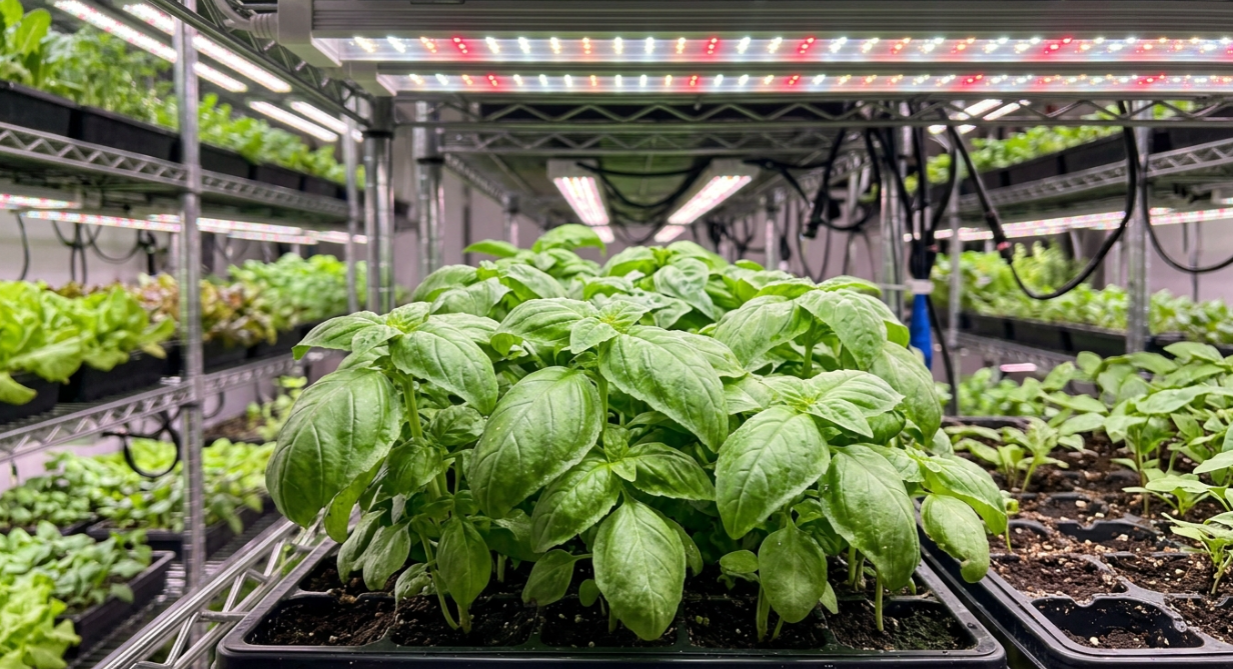
Standard PAR is 400 to 700 nm. That is the range used in most fixture specs, sensor calibrations, and lighting designs.
ePAR (extended PAR) expands the range to roughly 400 to 750 nm, capturing far-red photons that recent research suggests can contribute to photosynthesis when combined with shorter-wavelength photons. Apogee now sells ePAR sensors for this wider range.
There is a catch. Far-red photons also affect plant morphology. Research cautions that far-red can induce stem elongation associated with shade avoidance, especially in sole-source environments. Far-red is a tool with tradeoffs, not a free bonus.
For most growers reading about PAR vs PPFD, the standard 400 to 700 nm definition is what spec sheets and lighting designs use. Do not mix PAR and ePAR values unless you know exactly what the sensor and spec sheet are measuring. For more on how different wavelengths affect crops, the light spectra impact summary provides a research-backed overview.
Technical growers on Reddit debate ePAR regularly. One r/BudScience thread argued that PAR should remain 400 to 700 nm and ePAR treated separately, while noting that excessive far-red can cause unwanted stretch.
FAQ
Is PAR the same as PPFD?
No. PAR is the 400 to 700 nm wavelength range plants use for photosynthesis. PPFD is the measurement of how many PAR photons reach a surface per second, reported in µmol/m²/s. PAR defines the type of light. PPFD quantifies the amount.
Which matters more for grow-room decisions, PAR or PPFD?
PPFD. It is the number you use to evaluate canopy intensity, set fixture height, adjust dimming, and compare lighting layouts. PAR provides the underlying definition, but PPFD is the actionable metric.
What unit is PPFD measured in?
Micromoles per square meter per second (µmol/m²/s).
What does a PAR meter actually measure?
In common grower language, a “PAR meter” usually reports PPFD. Technically it is a quantum sensor that counts photons in the 400 to 700 nm range landing on its detector per second.
Can I use lux instead of PPFD?
Not for reliable plant-light decisions. Lux is weighted for human vision and overrepresents green light while underrepresenting blue and red. Any lux-to-PPFD conversion depends on the specific spectrum of the light source, so there is no universal conversion factor.
How do I convert PPFD to DLI?
DLI = PPFD × hours × 0.0036. For example, 500 µmol/m²/s for 16 hours gives a DLI of 28.8 mol/m²/day.
Does higher PPFD always mean higher yield?
No. Higher PPFD can improve yield only when the crop, CO₂ level, temperature, humidity, irrigation, and nutrition can support the additional photon load. Pushing PPFD without matching the environment wastes energy and can stress plants.
What is the difference between PPF and PPFD?
PPF (photosynthetic photon flux) is the total PAR output of a fixture, measured in µmol/s. PPFD is how that output distributes over the crop surface at a specific point. PPF is what the fixture produces. PPFD is what the plant receives.
Need spec sheets, PPFD maps, or technical documents for a lighting project? Browse the product documents library to find detailed fixture data for commercial applications.