PPFD vs DLI Explained (2026): Formula, Examples, Targets
Learn PPFD vs DLI in 2026: clear definitions, the conversion formula, crop targets, and pro tips. Calculate needs and optimize your grow—read now.
TL;DR
PPFD measures how much photosynthetically active light hits your canopy right now, reported in µmol·m⁻²·s⁻¹. DLI measures the total amount of that light delivered over a full day, reported in mol/m²/d. The formula connecting them is simple: DLI = PPFD × photoperiod (hours) × 3,600 ÷ 1,000,000. Neither metric is useful without the other. PPFD tells you intensity; DLI tells you whether your plants actually got enough light to grow.
PPFD is a snapshot. DLI is the full picture. That single distinction is the foundation of every lighting decision in controlled environment agriculture, yet it trips up growers at every experience level. A fixture spec sheet might boast 1,000 µmol/m²/s, but without knowing how many hours that light runs, you cannot determine whether your crop is getting the daily photon budget it needs.
This guide breaks down the PPFD vs DLI comparison, walks through the conversion formula with real numbers, provides crop-specific targets, and covers the practical nuances that most explanations skip.
Talk to a lighting specialist to translate these metrics into a plan for your facility.
Quick Answer: PPFD vs. DLI
PPFD measures the intensity of photosynthetic light reaching a plant canopy at a specific moment, while DLI measures the total amount of photosynthetic light the canopy receives over an entire day. PPFD is measured in µmol·m⁻²·s⁻¹, while DLI is measured in mol·m⁻²·d⁻¹.
The relationship is:
DLI = PPFD × photoperiod × 3,600 ÷ 1,000,000
For example, 500 µmol·m⁻²·s⁻¹ for 16 hours produces a DLI of 28.8 mol·m⁻²·d⁻¹.
In simple terms: PPFD tells you how intense the light is; DLI tells you how much light the plant receives over the entire day.
What Is PPFD?
PPFD stands for Photosynthetic Photon Flux Density. It measures the number of photosynthetically active photons (wavelengths between 400 and 700 nanometers) that land on a square meter of surface every second. The unit is µmol·m⁻²·s⁻¹, or micromoles per square meter per second.
Think of PPFD as the speedometer in your car. It tells you how fast light is arriving at any given moment, not how far you’ve traveled.
Why PPFD Replaced Lux and Lumens
Lux, lumens, and footcandles are weighted to human vision. They tell you how bright a room looks to your eyes, not how useful the light is for photosynthesis. Plants respond to photon counts in the 400 to 700 nm range, and human brightness perception skews heavily toward green wavelengths. A red or blue LED might look dim to you while delivering significant photosynthetic energy. That mismatch is why plant scientists shifted to PPFD decades ago, and why comparing LEDs to HPS using lux or lumens produces misleading results.
A Single Reading Isn’t Enough
One PPFD measurement taken at the center of a light footprint tells you almost nothing useful about your actual growing conditions. Light intensity drops off toward edges and corners. Commercial growers should map PPFD at a minimum of nine points across the canopy at plant height, then average those readings.
Practitioners on Reddit’s r/macrogrowery consistently flag this issue. One grower shared that raising fixtures 8 inches, which dropped peak output by about 5%, improved yield uniformity from 72% to 89%. The tradeoff was worth it. Uniform canopy lighting is usually more important than achieving the highest peak PPFD. A good target is keeping readings within ±10 to 15% across the entire footprint.
What Is DLI?
DLI stands for Daily Light Integral. It describes the total number of photosynthetically active photons delivered to a square meter over a full 24-hour period. The unit is mol/m²/d (moles per square meter per day).
Where PPFD is the speedometer, DLI is the odometer reading at the end of the day. It answers the question: how much total light did my plants receive today?
The Rain Gauge Analogy
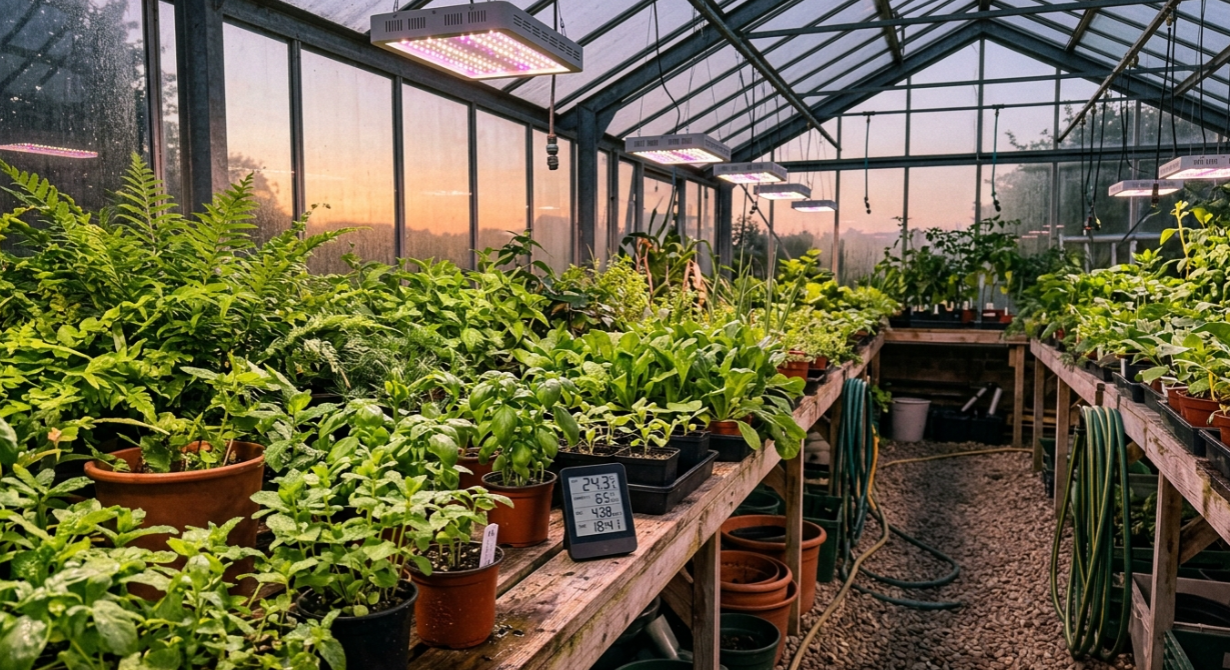
The best way to understand DLI comes from Michigan State University’s Extension program. A rain gauge in your backyard doesn’t measure how hard it’s raining at any given second. It measures the total amount of rain that accumulated over the day. If you empty it every night, you get a 24-hour total. DLI works the same way, but for photons instead of raindrops.
Why DLI Is the Better Planning Metric
A grower who knows only their PPFD is working with incomplete information. An 800 µmol/m²/s reading sounds impressive, but if the lights run for only 8 hours, the crop receives a very different daily photon budget than if they run for 16 hours. DLI combines both intensity and duration into a single number that directly correlates with crop outcomes like yield, quality, and growth rate.
For a deeper dive into how DLI shapes greenhouse lighting schedules, including seasonal adjustments and supplemental lighting timing, that guide walks through the full planning process.
What DLI Does Not Tell You
DLI is useful for quantifying the total daily photon dose, but it does not describe every aspect of a lighting environment.
DLI does not tell you:
How evenly light is distributed across the canopy
The maximum PPFD experienced by the plant
The minimum PPFD at the edges or lower canopy
The exact photoperiod used to deliver the light
The spectrum of the fixture
Whether the crop has sufficient CO₂, water, nutrients, or temperature control
Whether a particular PPFD level is appropriate for the crop
For that reason, DLI should be treated as one part of a lighting strategy rather than a standalone measure of lighting quality.
Same DLI, Different PPFD
A target DLI can be achieved through different combinations of PPFD and photoperiod.
Target DLI | Photoperiod | Required average PPFD |
|---|---|---|
20 | 12h | 463 |
20 | 16h | 347 |
20 | 18h | 309 |
20 | 20h | 278 |
30 | 12h | 694 |
30 | 16h | 521 |
30 | 18h | 463 |
30 | 20h | 417 |
40 | 12h | 926 |
40 | 16h | 694 |
40 | 18h | 617 |
40 | 20h | 556 |
The important takeaway is that DLI does not tell you how the photons were distributed through the day. Two schedules can produce the same DLI while exposing plants to different PPFD levels and photoperiods.
PPFD vs. DLI vs. PAR vs. PPF
These four terms are related, but they describe different aspects of plant lighting:
Term | What it measures | Unit | Main use |
|---|---|---|---|
PAR | Photosynthetically relevant wavelength range | 400–700 nm | Describes the light range used for traditional photosynthesis measurements |
PPF | Total photosynthetic photon output from a fixture | µmol/s | Comparing fixture photon output |
PPFD | Photosynthetic photon flux reaching a specific area | µmol·m⁻²·s⁻¹ | Measuring canopy light intensity |
DLI | Total photosynthetic photons received over a day | mol·m⁻²·d⁻¹ | Setting daily crop-light targets |
The easiest way to remember the relationship is:
PPF = how many photons the fixture produces.
PPFD = how many photons reach a square meter at a specific moment.
DLI = how many photons reach a square meter over an entire day.
PAR = the wavelength range being measured or discussed.
This distinction matters when comparing grow lights. A fixture can have a high PPF but produce mediocre PPFD at the canopy if its light is distributed over a large area. Likewise, a high PPFD does not automatically mean a high DLI because photoperiod determines how long that intensity is delivered.
PPFD vs DLI: Key Differences at a Glance
Metric | What it measures | Unit | Question it answers | Depends on |
|---|---|---|---|---|
PAR | Photosynthetically relevant light range | 400–700 nm | What wavelengths are being considered? | Light spectrum |
PPF | Total photosynthetic photon output | µmol/s | How many useful photons does the fixture produce? | Fixture output and spectrum |
PPFD | Photon density at the canopy | µmol·m⁻²·s⁻¹ | How intense is the light right now? | Fixture output, height, spacing, area |
DLI | Total photon dose per day | mol·m⁻²·d⁻¹ | How much light did the crop receive today? | PPFD and photoperiod |
The PPFD vs DLI relationship is complementary, not competitive. You need both. PPFD without a time component is like knowing your speed without knowing how long you drove. DLI without knowing the underlying PPFD can mask problems with light delivery efficiency (more on that below).
The Conversion Formula
PPFD to DLI
DLI = PPFD × photoperiod (hours) × 3,600 ÷ 1,000,000
The 3,600 converts hours to seconds (since PPFD is per-second). Dividing by 1,000,000 converts micromoles to moles.
DLI to PPFD
PPFD = DLI × 1,000,000 ÷ (photoperiod in hours × 3,600)
This reverse formula is what you use when you have a target DLI for your crop and need to figure out what PPFD your fixtures should deliver.
Virginia Tech’s extension guide offers a useful shortcut constant: multiply your target DLI by 277.8, then divide by your photoperiod in hours, to get the required PPFD. For example, a target DLI of 12 mol/m²/d over an 18-hour photoperiod requires approximately 185 µmol/m²/s.
Worked Examples
Example 1: 600 PPFD over a 12-hour photoperiod
600 × 12 × 3,600 ÷ 1,000,000 = 25.9 mol/m²/d
Example 2: 600 PPFD over an 18-hour photoperiod
600 × 18 × 3,600 ÷ 1,000,000 = 38.9 mol/m²/d
Same fixture intensity, dramatically different daily light dose. That’s why the PPFD vs DLI distinction matters so much in practice.
Example 3: 300 PPFD over a 16-hour photoperiod
300 × 16 × 3,600 ÷ 1,000,000 = 17.3 mol/m²/d
Quick-Reference PPFD-to-DLI Table
PPFD (µmol/m²/s) | 12h photoperiod | 16h photoperiod | 18h photoperiod |
|---|---|---|---|
200 | 8.6 | 11.5 | 13.0 |
300 | 13.0 | 17.3 | 19.4 |
400 | 17.3 | 23.0 | 25.9 |
500 | 21.6 | 28.8 | 32.4 |
600 | 25.9 | 34.6 | 38.9 |
800 | 34.6 | 46.1 | 51.8 |
1,000 | 43.2 | 57.6 | 64.8 |
1,200 | 51.8 | 69.1 | 77.8 |
All values in mol/m²/d. Bookmark this table. It covers the most common scenarios in both greenhouse and indoor cultivation.
DLI Targets by Crop
Different crops have different daily light requirements. These targets come from university extension research and industry standards.
Crop | DLI Target (mol/m²/d) | Notes |
|---|---|---|
Leafy greens (general) | 6–12 | Minimum for commercially viable growth rates |
Lettuce | 12–17 | Virginia Tech research places optimum at ~17 |
Herbs and microgreens | 8–14 | Varies by species |
Tomato | 20–30+ | Higher DLI correlates with better fruit quality |
Pepper, cucumber | 20–40 | Flowering/fruiting crops need more light |
Cannabis (seedling/clone) | 15–20 | Resource Innovation Institute guidelines |
Cannabis (vegetative) | 20–40 | Wide range due to strain variation and CO₂ levels |
Cannabis (flower) | 35–50 | Constrained to 12h photoperiod |
For crop-specific details, these guides cover cannabis DLI targets by stage, tomato lighting requirements, and lettuce lighting requirements in much more depth.
Cannabis PPFD Targets by Growth Stage
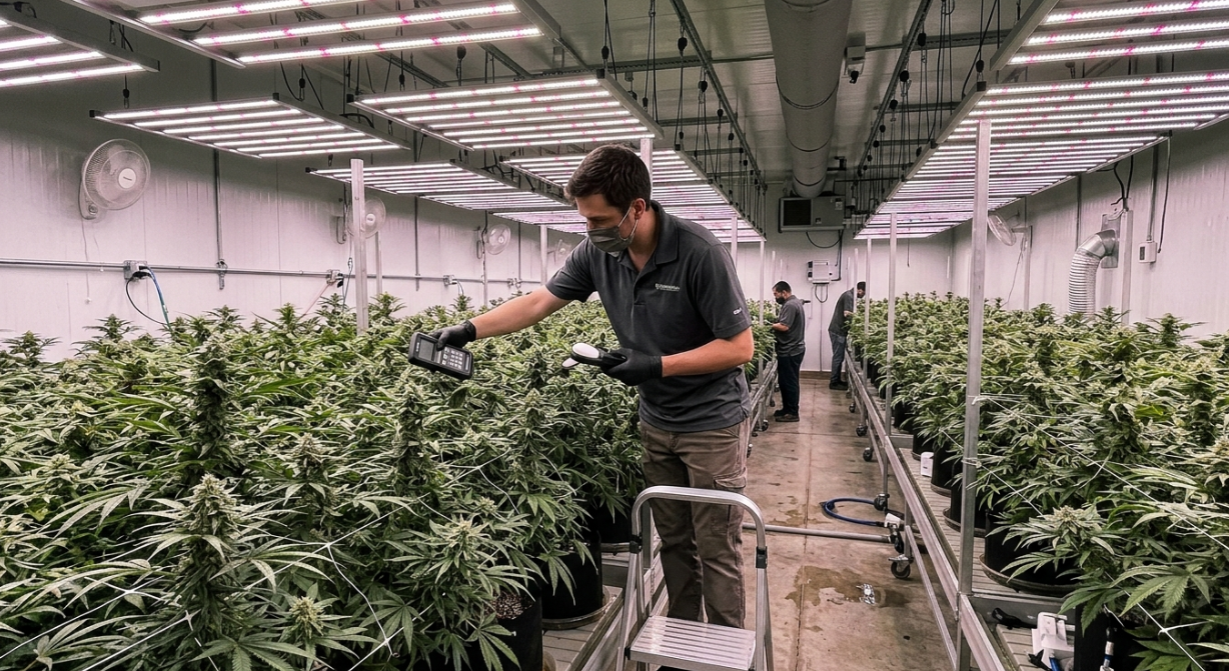
Cannabis deserves special attention because its photoperiod constraint during flowering makes the PPFD vs DLI relationship especially important.
Common PPFD ranges: 100 to 300 µmol/m²/s for seedlings, 300 to 600 for vegetative growth, and 600 to 1,000+ for flowering. With CO₂ enrichment, commercial flower rooms regularly target 900 to 1,500 µmol/m²/s.
Because flowering occurs under a strict 12-hour photoperiod, growers cannot extend light hours to reach higher DLI values. The only way to increase DLI in flower is to increase PPFD. A target DLI of 40 mol/m²/d under a 12-hour photoperiod requires approximately 926 µmol/m²/s. Pushing to 50 DLI requires about 1,157 µmol/m²/s, which starts to demand CO₂ supplementation for the plant to actually use that light productively.
Here’s a striking finding from peer-reviewed cannabis research: dry flower yield increased linearly with increasing canopy-level PPFD up to 1,800 µmol/m²/s, even though leaf-level photosynthesis saturated well below that intensity. The whole plant keeps producing more when individual leaves have theoretically maxed out. This happens because lower and inner canopy leaves are still below saturation, absorbing the photons that filter through the upper canopy.
Why the Same DLI Can Produce Different Results
This is the nuance most PPFD vs DLI explanations miss entirely.
Two crops can receive identical DLI values and produce different outcomes depending on how that DLI was delivered. Research at the University of Georgia found that greenhouse crops grow faster with lower PPFD and longer photoperiods compared to higher PPFD and shorter photoperiods, even when total DLI is the same.
The biological reason is straightforward. The quantum yield of photosystem II, which represents the fraction of absorbed light actually used for photochemistry, decreases as PPFD increases. In plain language, plants waste more light energy as heat when intensity gets very high. Spreading the same total dose over more hours lets the plant process photons more efficiently.
The data is compelling. In lettuce, extending the photoperiod from 12 to 21 hours increased shoot dry weight by 28 to 30% when DLI was held constant. Increasing DLI by extending the photoperiod consistently resulted in more growth than increasing DLI by raising PPFD, along with higher light use efficiency and energy use efficiency.
The Photoperiod Constraint for Short-Day Crops
This strategy has a hard limit for photoperiod-sensitive crops. Cannabis, chrysanthemum, and strawberry are short-day plants. They require an uninterrupted dark period exceeding a critical night length to initiate or maintain flowering. Extending the light period to chase a higher DLI will disrupt the flowering trigger entirely.
For cannabis flower rooms locked to a 12-hour schedule, growers can only increase DLI by pushing PPFD higher, not by adding hours. For a thorough discussion of how photoperiod management interacts with lighting strategy in cannabis, that guide covers the critical details.
For lettuce, herbs, and other day-neutral or long-day crops in vertical farms or greenhouses, the opposite applies. Running fixtures at moderate PPFD for extended hours is both biologically superior and more energy efficient.
Greenhouse Context: Where DLI Thinking Pays Off Most
Greenhouses are where the PPFD vs DLI framework becomes most practically consequential, because outdoor light varies dramatically by season and geography.
The Seasonal DLI Problem
Throughout the year, outdoor DLI ranges from 5 to 60 mol/m²/d depending on latitude and season. But inside a greenhouse, values seldom exceed 25 mol/m²/d due to glazing materials, structural shading, cloud cover, and day length.
Winter in northern latitudes hits hardest. In the 13 most northern U.S. states, average outdoor DLI in December is only 5 to 10 mol/m²/d. In western Washington, it drops below 5. After greenhouse transmission losses of 35 to 50%, the crop may receive only 2 to 4 mol/m²/d. That’s far below the minimum for any commercially viable crop.
Supplemental Lighting as the Bridge
Calculating the gap between your greenhouse DLI and your crop’s target DLI is the most direct way to size supplemental lighting. If your tomatoes need 25 mol/m²/d and your greenhouse delivers 8 during winter months, you need supplemental fixtures capable of providing 17 mol/m²/d.
The Altus 1K is designed for exactly this scenario, providing high-output supplemental lighting for greenhouse top-canopy applications.
For a complete walkthrough of how much supplemental lighting a greenhouse needs, including sizing calculations and seasonal adjustment strategies, that guide picks up where this explanation leaves off.
Don’t Forget the Lower Canopy
Standard DLI discussions focus on the top of the canopy. But in dense crops like cannabis, tomato, and pepper, lower canopy leaves receive a fraction of the PPFD hitting the top. This creates a DLI deficit in the lower plant that limits fruit development, reduces quality, and wastes the plant’s own invested energy in those leaves.
Under-canopy lighting addresses this directly by adding photons from below. Research on this approach has documented meaningful yield increases without proportional increases in total energy consumption, because the added light targets the most photon-starved tissue in the canopy.
Common Mistakes to Avoid
1. Calling PAR a measurement. PAR (Photosynthetically Active Radiation) describes the wavelength range of 400 to 700 nm. It is not a number you read off a sensor. When people say “PAR levels,” they almost always mean PPFD. The distinction matters because conflating the two leads to confusion when reading spec sheets and research papers.
2. Using PPFD without time context. A fixture delivering 800 µmol/m²/s sounds great. But 800 PPFD for 10 hours yields 28.8 DLI, while 800 PPFD for 16 hours yields 46.1 DLI. The crop outcome will be completely different. Always pair PPFD with photoperiod.
3. Assuming same DLI means same result regardless of delivery. As covered above, 30 DLI delivered at 1,000 PPFD for ~8.3 hours produces less growth than 30 DLI delivered at 463 PPFD for 18 hours, at least for crops that tolerate longer photoperiods.
4. Measuring with a lux meter instead of a quantum sensor. Lux meters are weighted to human vision and will give you readings that do not reflect what the plant experiences. Invest in a proper quantum sensor (PAR meter) that measures photon flux in the 400 to 700 nm range.
5. Taking one center reading as representative. The center of any light footprint is the brightest spot. Edges and corners are dimmer. Map at least 9 points across your canopy, average them, and check uniformity. Over-lit centers paired with under-lit edges is the most common layout mistake in commercial rooms.
6. Ignoring CO₂ coupling. In practice, PPFD, DLI, and CO₂ should be treated as one system. Increasing PPFD without adequate CO₂, irrigation, nutrition, temperature, and VPD usually produces diminishing returns. Practitioners on grower forums like Overgrow debate this constantly, with many noting that pushing past 600 to 900 µmol/m²/s without supplemental CO₂ wastes electricity without a proportional yield gain.
What Is PPFD Uniformity?
PPFD uniformity describes how evenly light is distributed across the growing area. A fixture can produce an excellent peak PPFD while still creating poor growing conditions if the edges of the canopy receive substantially less light.
Measure PPFD at multiple locations across the canopy rather than relying on a single center reading.
A basic uniformity assessment should record:
Minimum PPFD
Maximum PPFD
Average PPFD
Measurement-point count
Light uniformity across the canopy
Canopy height at which measurements were taken
For commercial lighting designs, the goal is not simply to maximize the highest PPFD reading. It is to provide an appropriate average PPFD with sufficient uniformity across the entire production area.
Add this formula
PPFD uniformity = minimum PPFD ÷ average PPFD × 100
You can also discuss the commonly used minimum-to-average approach rather than presenting ±10–15% as a universal rule.
That's important because your current statement:
“A good target is keeping readings within ±10 to 15% across the entire footprint.”
is too prescriptive without specifying the measurement method or application.
How to Measure and Apply These Metrics
Step 1: Get the right tool. Use a quantum sensor (also called a PAR meter) that reads in µmol/m²/s. Smartphone apps can provide ballpark estimates, but a dedicated sensor is far more accurate for commercial decisions.
Step 2: Map your canopy. Take readings at a grid of points across the growing area, all at canopy height. Nine points minimum for a single fixture footprint, more for larger rooms. Record each reading.
Step 3: Calculate your average PPFD. Add all readings and divide by the number of measurement points. Check that the spread stays within ±10 to 15% of the average. If it doesn’t, adjust fixture height, spacing, or angle.
Step 4: Determine your target DLI. Use the crop target table above to identify the DLI your plants need for the current growth stage.
Step 5: Back-calculate the PPFD you need. Using the reverse formula (PPFD = DLI × 1,000,000 ÷ (hours × 3,600)), calculate the average PPFD your fixtures must deliver given your photoperiod. If your current average falls short, you either need more light output or more hours (if the crop allows it).
Step 6: Monitor and adjust seasonally. In greenhouses, outdoor light contribution changes month to month. Recalculate your supplemental PPFD requirements at least quarterly, or use a light sensor system that adjusts automatically.
Frequently Asked Questions
Is PPFD the same as PAR?
No. PAR (Photosynthetically Active Radiation) describes the wavelength range of 400 to 700 nm that plants use for photosynthesis. PPFD is the actual measurement of how many photons in that range hit a given area per second. PAR is the category; PPFD is the number. For a fuller breakdown of the terminology, the cannabis LED grow lights glossary covers these terms and more.
Can I use lux or lumens to estimate PPFD?
Not accurately. Lux and lumens are weighted to human visual sensitivity, which peaks in the green-yellow range. A red or blue LED might deliver substantial photosynthetic energy while registering low lux. There is no reliable universal conversion factor because the ratio between lux and PPFD changes with every light spectrum. Always use a quantum sensor for plant lighting decisions.
How do I convert PPFD to DLI?
Multiply your PPFD by the number of hours in your photoperiod, then multiply by 3,600, then divide by 1,000,000. For example: 500 µmol/m²/s × 16 hours × 3,600 ÷ 1,000,000 = 28.8 mol/m²/d.
What DLI does cannabis need in flower?
Most commercial cannabis operations target 35 to 50 mol/m²/d during the flowering stage. Because flower runs on a strict 12-hour photoperiod, reaching 40 DLI requires approximately 926 µmol/m²/s of average canopy PPFD. Higher targets increasingly demand CO₂ supplementation.
Does higher PPFD always mean better growth?
Not necessarily. As PPFD increases, the efficiency of photosynthesis decreases because plants convert more light energy into heat rather than biomass. For crops that allow extended photoperiods, moderate PPFD over more hours often outperforms high PPFD over fewer hours at the same DLI. However, for short-day crops like cannabis in flower, higher PPFD is the only way to increase DLI since the photoperiod is fixed.
Why does my greenhouse DLI drop so much in winter?
Two factors compound. First, winter days are shorter and the sun sits lower in the sky, reducing outdoor DLI. Second, greenhouse glazing, structural elements, and accumulated grime absorb or reflect 35 to 50% of incoming light. A location with 8 mol/m²/d of outdoor winter DLI may only deliver 3 to 4 mol/m²/d to the crop inside the greenhouse.
Should I measure PPFD at the top of the canopy or throughout the plant?
Both, ideally. Top-of-canopy PPFD is the standard measurement for fixture performance and lighting design. But in tall, dense crops, lower canopy levels receive significantly less light. Measuring at multiple heights helps you understand whether an under-canopy lighting strategy might close a DLI deficit that top lights alone cannot address.
What is the relationship between PPFD, DLI, and CO₂?
They form a system. Increasing PPFD drives faster photosynthesis, but only if the plant has enough CO₂ to keep up. Under ambient CO₂ (~420 ppm), most crops see diminishing returns above 600 to 800 µmol/m²/s. With CO₂ enrichment to 1,200 to 1,500 ppm, the plant can productively use much higher PPFD levels, which in turn raises the achievable DLI.
Understanding the PPFD vs DLI relationship is foundational, but translating these numbers into a specific lighting plan for your facility requires accounting for crop type, photoperiod, CO₂ strategy, fixture layout, and seasonal variation. If you’re sizing a new project or evaluating whether your current setup is leaving yield on the table, schedule a free consultation to work through the numbers with a lighting specialist.