Cannabis Lighting Efficiency 2026: LED vs HPS ROI Guide
Learn how cannabis lighting efficiency, PPE, and uniformity cut energy 40–60%, reduce HVAC load, and boost g/W. See 2026 benchmarks—get a consult.
TL;DR
Cannabis lighting efficiency measures how effectively your grow lights convert electricity into plant-usable photons, expressed as PPE (µmol/J). Top LED fixtures in 2025 deliver 3.0 to 3.6 µmol/J, nearly double what HPS produces. But true efficiency goes beyond the fixture: it includes how evenly light reaches the canopy, how much waste heat your HVAC has to remove, and how many grams of flower you harvest per watt consumed. Getting this right can cut electricity costs by 40 to 60% and push yields past 1.5 g/W.
Talk to a lighting expert about your facility’s efficiency targets in a free 15-minute consultation.
Quick Answer: What Is the Most Efficient Cannabis Lighting?
Cannabis lighting efficiency measures how effectively a grow light converts electricity into photosynthetically active photons, typically expressed as photosynthetic photon efficacy (PPE) in µmol/J. Modern commercial LED fixtures can achieve approximately 3.0–3.6 µmol/J, while conventional high-pressure sodium (HPS) systems generally deliver fewer photons per unit of electricity. For facilities operating at the same canopy light target, switching from HPS to a high-efficiency LED system can reduce lighting electricity consumption substantially. The actual savings and return on investment depend on fixture efficacy, operating hours, electricity rates, cooling requirements, installation costs, and available utility incentives.
Key takeaway: Compare cannabis lights by PPE, canopy-level PPFD uniformity, total operating costs, and payback period—not wattage or fixture price alone.
What Cannabis Lighting Efficiency Actually Measures
Cannabis lighting efficiency is the ratio of plant-usable light output to electrical energy input. The metric that matters is Photosynthetic Photon Efficacy (PPE), measured in micromoles per joule (µmol/J). It tells you how many photosynthetically active photons a fixture produces for every joule of electricity it consumes.
The higher the PPE, the less you pay to deliver the same amount of light to your canopy.
This is different from how efficiency works in office or residential lighting, where lumens (a measure of human-perceived brightness) dominate spec sheets. Plants don’t care about lumens. They care about photons in the 400 to 700 nm range, what the industry calls PAR (photosynthetically active radiation). A fixture can appear dim to your eyes and still flood the canopy with usable photons, or it can look blindingly bright while wasting energy on wavelengths plants barely absorb.
Wattage is equally misleading. A 600W fixture with 3.0 µmol/J efficacy produces far more usable light than a 1,000W fixture at 1.5 µmol/J, while consuming 40% less electricity. Comparing fixtures on wattage is like comparing cars on fuel tank size instead of miles per gallon. For a deeper look at this trap, see this breakdown of the common mistake when comparing LEDs to HPS.
Why PPE Trumps Spectral Fine-Tuning
Growers sometimes obsess over spectral ratios (how much red, blue, or far-red a fixture emits) at the expense of paying attention to efficacy. A peer-reviewed study from Utah State University (Westmoreland et al., 2021) found that increasing the blue photon fraction from 4% to 20% caused a consistent 12% decrease in yield, but the efficacy difference between the tested fixtures (ranging from 1.7 to 2.5 µmol/J) drove costs far more than spectral adjustments.
The takeaway: fixture efficacy has a greater impact on ROI than spectral fine-tuning. Get your PPE right first. Dial in spectrum second.
PPE Benchmarks: Where the Industry Stands in 2025
Cannabis lighting efficiency has improved dramatically over the past decade. Here’s how the numbers have progressed:
Technology / Era | PPE (µmol/J) | Notes |
|---|---|---|
Single-ended HPS | 1.0–1.3 | Legacy technology, largely phased out |
Double-ended HPS | 1.7–1.9 | The efficiency ceiling for non-LED |
Commercial LED (2014) | ~1.7 | First parity with DE-HPS |
Commercial LED (2020) | ~2.6 | LED pulls clearly ahead |
Commercial LED (2025) | 3.0–3.6 | Top-tier fixtures, nearly 2x HPS |
Between 2018 and 2024, average LED photosynthetic photon efficacy climbed from 1.7 to 2.8 µmol/J, a 65% gain. Today’s best commercial cannabis LED fixtures exceed 3.0 µmol/J, approaching the practical physical limits of the technology. Research from Utah State University shows that the theoretical maximum efficiency for phosphor-converted white LEDs is about 76%, and for red LEDs about 81%. Current top-tier fixtures are already closing in on those ceilings, meaning future gains will come from system design rather than chip-level breakthroughs.
The market has responded accordingly. When Cannabis Business Times first surveyed growers in 2016, only 15% used LED as their primary lighting. By 2025, nearly 80% of indoor and greenhouse cultivators report relying on LEDs, with 83% citing energy efficiency as the top benefit.
LED vs. HPS Cannabis Lighting: Efficiency and Operating Costs
LED and high-pressure sodium (HPS) fixtures differ in photon efficacy, power requirements, heat management, maintenance, and initial cost. For a fair comparison, evaluate the fixtures at the same target canopy PPFD and similar light distribution, rather than comparing wattage or fixture prices alone.
Comparison factor | Modern commercial LED | Conventional HPS |
|---|---|---|
Photosynthetic photon efficacy (PPE) | Many high-performance fixtures achieve 3.0 µmol/J or higher | Commonly around 1.7–1.9 µmol/J for double-ended systems |
Electricity required for equivalent photon output | Generally lower | Generally higher |
Heat management | Usually reduces the cooling burden associated with lighting at equivalent photon output | Typically creates a greater cooling challenge |
Light distribution | Linear fixtures can provide broad, uniform canopy coverage when correctly designed | Depends on reflector design, mounting height, and spacing |
Maintenance | Often longer service life, with driver and fixture maintenance still required | Lamp replacement and reflector maintenance may be necessary |
Initial investment | Often higher | Often lower for existing or conventional systems |
Utility incentives | May qualify when the product and project meet program requirements | Typically not eligible for LED-specific incentives |
Financial payback | Depends on energy savings, rebates, capital cost, and operating conditions | Avoids an immediate LED retrofit expense but may retain higher operating costs |
Which is better? High-efficiency LED lighting is generally the stronger choice for reducing electricity use in indoor cultivation facilities, particularly where electricity and cooling costs are high. However, the best investment depends on the existing equipment, the lighting design, the local utility program, and the facility's expected operating life.
Note: PPE ranges are indicative rather than universal. Verify individual fixture specifications using independent test data and current product listings. Rebate eligibility must be confirmed with the relevant utility.
How Efficiency Is Measured and Verified
Manufacturer claims on PPE vary in reliability. The best way to filter honest numbers from marketing fiction is third-party certification, specifically the DesignLights Consortium (DLC) Horticultural listing.
DLC Hort V4.0: What Cannabis Growers Need to Know in 2026
The DesignLights Consortium (DLC) Horticultural Lighting Technical Requirements V4.0 became effective on April 18, 2025. The standard raised the minimum photosynthetic photon efficacy (PPE) for qualifying LED horticultural fixtures to 2.5 µmol/J, an 8.7% increase over the previous V3.0 threshold. The transition also included a January 5, 2026 delisting date for products that did not complete the required V4.0 update process.
For cannabis cultivators evaluating lighting upgrades in 2026, DLC qualification is an important equipment-screening step. However, listing alone does not guarantee that a fixture will qualify for every utility rebate. Programs can impose additional requirements involving eligible equipment, project size, installation, controls, documentation, and application timing.
Before purchasing fixtures, take these steps:
Search the DLC Qualified Products List for the exact fixture model.
Confirm that its listing is current and meets the applicable Hort V4.0 requirements.
Ask your utility or rebate administrator to confirm project eligibility before committing to the purchase.
Obtain the required product specifications, installation estimates, and supporting documentation.
Include the confirmed incentive amount in your LED retrofit payback calculation.
For more information, review the official DLC Horticultural Technical Requirements and Thrive Agritech's guide to DLC-listed LED grow lights.
What to Verify on a Spec Sheet
When evaluating a fixture’s efficiency claims, look for:
LM-79 test report from an accredited lab (not just manufacturer testing)
DLC listing number (searchable on the DLC QPL)
PPE at operating conditions, not just peak efficiency at low drive current
PPFD uniformity map, because a high-PPE fixture poorly spaced wastes photons on walls and aisles
Explore your facility’s rebate opportunities before spec’ing fixtures, as incentive eligibility shapes which products belong on your shortlist.
How to Measure Cannabis Lighting Efficiency in an Existing Facility
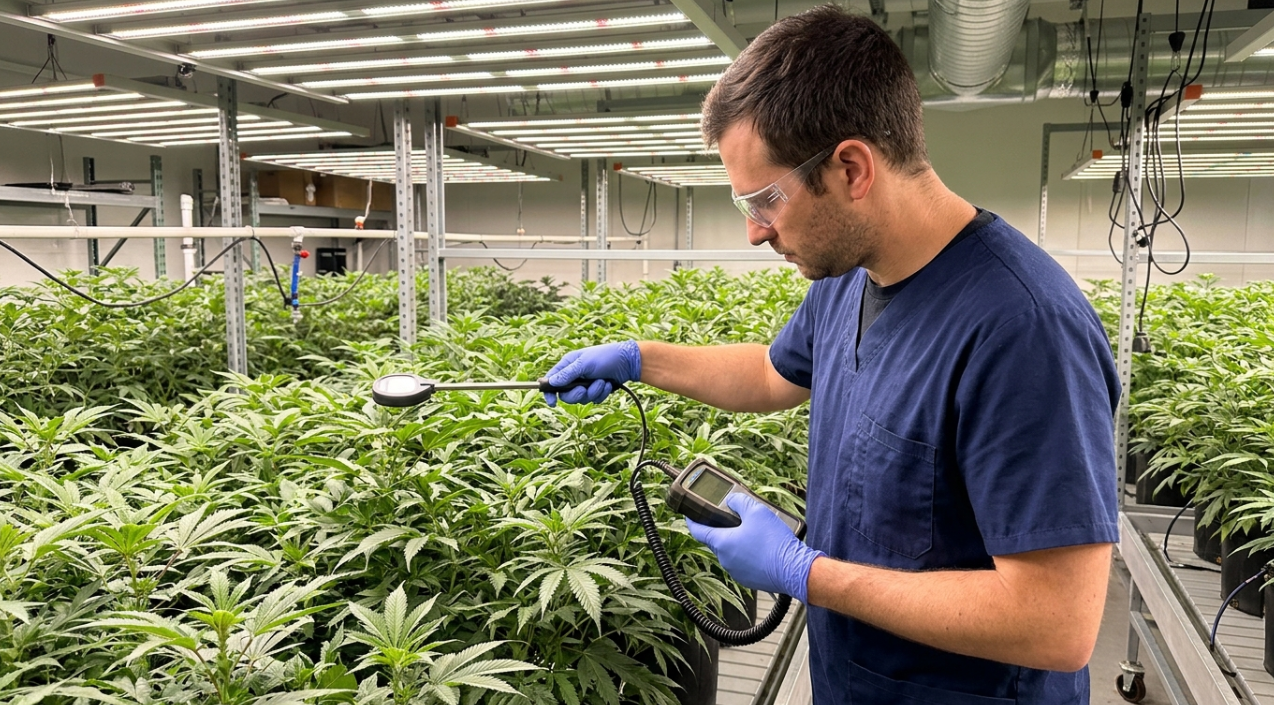
A lighting efficiency audit establishes how much electricity your current system consumes and how effectively it delivers light to the canopy. Use the following checklist before upgrading fixtures or changing your lighting layout.
Measurement | What to record | Why it matters |
|---|---|---|
Fixture power | Actual watts drawn at the wall | Establishes the electrical baseline |
Fixture PPE | Independently tested µmol/J | Shows photon output per unit of electricity |
Canopy PPFD | Measurements across a consistent grid | Reveals underlit areas, hot spots, and uneven distribution |
Photoperiod | Hours of lighting per day | Determines daily electricity consumption and DLI |
Daily light integral (DLI) | Daily photon exposure in mol/m²/day | Shows how much light reaches the canopy over the day |
Electricity tariff | Actual applicable cost per kWh | Converts energy consumption into operating cost |
HVAC energy | Measured or modeled cooling-system consumption | Helps quantify the additional energy associated with heat removal |
Crop output | Consistently measured saleable dry flower | Supports yield and energy-use comparisons |
Calculate lighting energy use
Lighting energy (kWh) = Lighting power (kW) × Operating hours
For example, a 60 kW lighting system operating for 12 hours consumes 720 kWh per day.
Calculate daily light integral
When average canopy PPFD is known:
DLI (mol/m²/day) = Average PPFD (µmol/m²/s) × Lighting hours × 0.0036
For an average PPFD of 1,000 µmol/m²/s over 12 hours, DLI is 43.2 mol/m²/day.
Repeat measurements using the same sampling grid and comparable crop-stage conditions. Record fixture settings, dimming levels, and sensor calibration so that before-and-after comparisons remain meaningful.
The objective is to identify whether the largest opportunity lies in fixture efficacy, light distribution, operating schedules, or the interaction between lighting and HVAC.
The True Cost of Inefficient Cannabis Lighting
Lighting accounts for roughly 40% of total electricity consumption in a typical indoor cannabis facility. The numbers add up fast.
Facility-Level Energy Consumption
Commercial cannabis operations consume between 2,000 and 5,000 kilowatt-hours per pound of finished flower, according to estimates cited by MJBizDaily. Cannabis cultivation accounts for as much as 1% of total U.S. electricity use.
In high-rate markets like California or the Northeast, electricity costs can reach $300 to $500 per pound of cannabis produced, representing 25% or more of total production costs. For more strategies on cutting these numbers, read about reducing operating expenses in cannabis and food production facilities.
The HVAC Multiplier: The Hidden Cost Most Growers Miss
This is the angle most efficiency discussions skip entirely. Every watt a fixture wastes as heat doesn’t just disappear. It becomes a cooling load your HVAC system has to handle. Inefficient lighting forces you to spend money twice: once to generate the heat, and again to remove it.
A fixture running at 1.7 µmol/J converts a smaller share of input energy into photons and a larger share into heat compared to a fixture at 3.0 µmol/J. The difference compounds across hundreds of fixtures in a commercial facility. Practitioners on electrical forums note that cannabis grow facilities present unique load-sizing challenges because lighting loads run continuously at high wattage, driving both demand charges and HVAC sizing.
Centralized power architectures take this a step further by relocating LED drivers outside the grow room entirely. This removes the driver’s waste heat from the canopy environment, cutting HVAC burden beyond what an LED swap alone achieves.
LED vs. HPS Cannabis Lighting ROI: How to Calculate Payback
The return on investment (ROI) of a cannabis lighting retrofit depends on how much electricity the new fixtures save, how the change affects cooling costs, and how much the upgrade costs after rebates. A reliable calculation compares lighting systems that deliver similar canopy-level light intensity and coverage.
Step 1: Calculate annual lighting electricity use
Use this formula:
Annual lighting energy (kWh) = Total lighting power (kW) × Operating hours per day × Operating days per year
For example, a lighting system drawing 100 kW and operating for 12 hours per day over 365 days consumes:
100 kW × 12 hours × 365 days = 438,000 kWh per year
Use measured wall power where possible, rather than nominal fixture wattage.
Step 2: Calculate annual lighting electricity cost
Annual lighting cost = Annual lighting energy (kWh) × Electricity rate ($/kWh)
At an illustrative electricity rate of $0.12/kWh, the 100 kW system above costs $52,560 per year to operate.
Step 3: Estimate the electricity savings from an LED upgrade
For an initial estimate, compare the PPE of the existing and proposed fixtures at an equivalent photon-output target:
Estimated LED power = Existing lighting power × (Existing PPE ÷ LED PPE)
Suppose the existing system draws 100 kW at 1.8 µmol/J and the proposed LED system achieves 3.0 µmol/J:
100 kW × (1.8 ÷ 3.0) = 60 kW estimated LED power
The estimated reduction is 40 kW, or 40% of lighting power, assuming equivalent total photon output and comparable system boundaries.
Annual energy savings:
40 kW × 12 hours × 365 days = 175,200 kWh
At $0.12/kWh, estimated annual lighting electricity savings equal $21,024.
This is a simplified comparison, not a guarantee of actual savings. Final design calculations should account for fixture layout, delivered canopy PPFD, dimming, driver losses, operating schedules, and light distribution.
Step 4: Include cooling savings and rebates
Calculate cooling-related electricity savings separately, using HVAC performance data or a facility-specific engineering estimate. Do not assume that every watt saved in lighting produces an equal additional watt of HVAC savings.
Subtract any confirmed utility rebate from the installed project cost, including fixtures, controls, electrical work, installation, and commissioning.
Step 5: Calculate simple payback
Simple payback period (years) = Net installed project cost ÷ Annual net operating savings
Annual net operating savings should include lighting electricity savings and substantiated cooling and maintenance savings, less any additional annual costs.
For example, if a retrofit costs $60,000 after rebates and delivers $25,000 in verified annual operating savings:
$60,000 ÷ $25,000 = 2.4 years simple payback
This illustrative example excludes financing, taxes, energy-price changes, equipment degradation, and the time value of money. Use a discounted cash-flow analysis for major capital investments.
What to include in a complete lighting ROI assessment
Existing and proposed fixture counts, wall power, and PPE
Canopy PPFD maps and target light levels
Annual operating hours and electricity tariffs
Cooling-system efficiency and measured cooling demand
Fixture, installation, controls, and commissioning costs
Confirmed utility rebates and application requirements
Warranty, maintenance, and expected equipment life
Any measured change in saleable yield or crop quality
The strongest retrofit decision is based on measured facility data and a documented lighting design, not a generic claim that LEDs always pay for themselves within a fixed number of years.
How Much Lighting Power Can a More Efficient Fixture Save?
For equivalent total photon output, required fixture power is approximately inversely proportional to PPE. The following table uses a hypothetical 100 kW lighting system operating at 1.8 µmol/J as the baseline.
Proposed LED PPE | Estimated LED power | Lighting power reduction | Estimated annual energy savings at 12 hours/day |
|---|---|---|---|
2.5 µmol/J | 72 kW | 28% | 122,640 kWh |
3.0 µmol/J | 60 kW | 40% | 175,200 kWh |
3.5 µmol/J | 51.4 kW | 48.6% | 212,694 kWh |
Assumptions: Existing lighting power is 100 kW at 1.8 µmol/J; all systems deliver equivalent total photon output; operation is 12 hours per day for 365 days; and the comparison excludes HVAC savings, fixture-layout differences, and dimming.
These figures are theoretical estimates for comparing efficacy, not guaranteed facility-level energy savings.
Three Layers of Cannabis Lighting Efficiency
Most growers think of lighting efficiency as a single number on a spec sheet. In practice, it operates on three layers, and optimizing only one while ignoring the others leaves money on the table.
Layer 1: Fixture Efficiency (PPE)
This is the starting point. It covers LED chip quality, driver efficiency, thermal management, and optical design. A fixture’s PPE tells you how efficiently it converts wall power into PAR photons. The 2025 benchmark for top-tier commercial fixtures is 3.0 to 3.6 µmol/J.
Layer 2: Distribution Efficiency
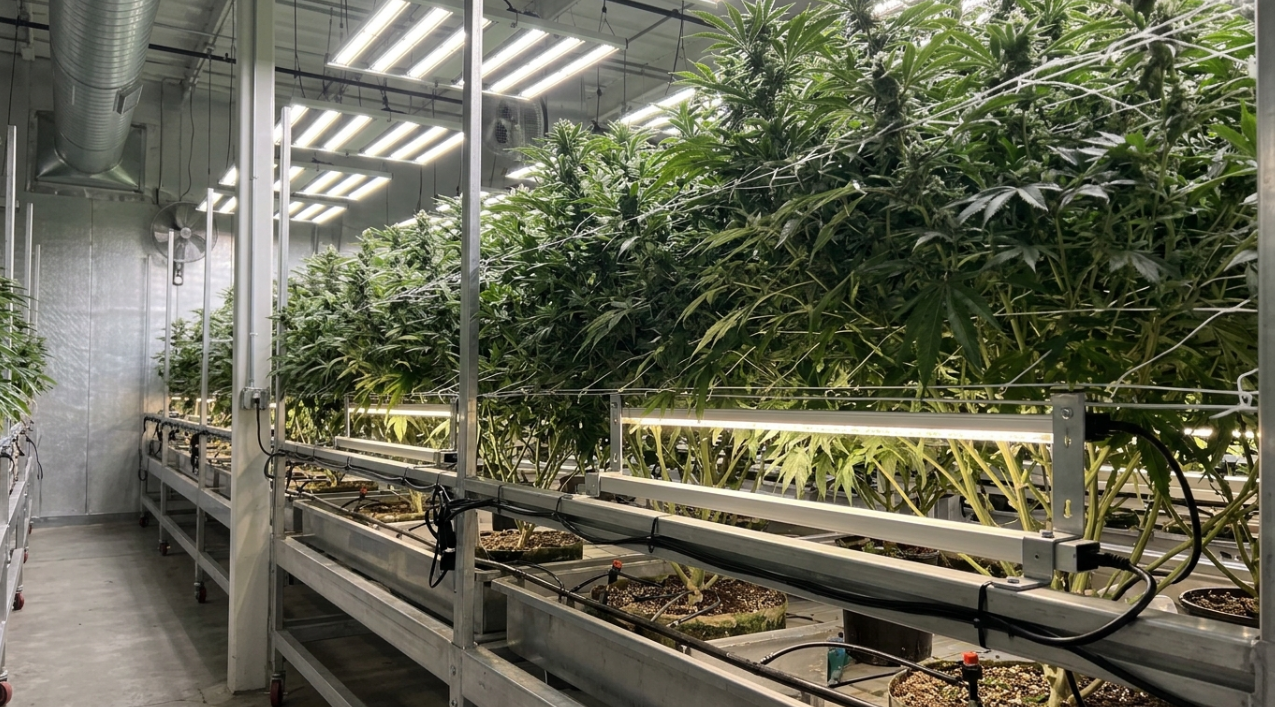
A high-PPE fixture mounted in the wrong position or at the wrong spacing still wastes light. Distribution efficiency is about getting photons where plants actually need them.
Uniformity matters more than peak PPFD. An uneven light map means some plants are light-starved while others receive more than they can use. Tight design-to-install PPFD variance (within ±5%) is a sign that a lighting plan was engineered, not guessed at. For practical guidance on getting this right, see the canopy light uniformity guide.
Under-canopy lighting is an efficiency strategy, not just a yield play. A 2025 peer-reviewed study published in Plants found that subcanopy and inter-canopy lighting significantly improve both yields and energy use efficiency. Adding light below the canopy, where top lights can’t penetrate, captures production from lower bud sites without increasing total top-light power. Industry surveys show that 51% of commercial growers are now interested in exploring under-canopy lighting as a complement to overhead fixtures.
Layer 3: System Efficiency
System efficiency considers the entire electrical and environmental infrastructure. This is where power architecture, HVAC interaction, and demand-charge management come into play.
Centralized power platforms like OptiDrive relocate LED drivers from inside the grow room to a central equipment area. The benefits compound: fewer in-room components to fail, lighter and smaller fixtures, reduced heat above the canopy, and lower HVAC loads. The total kWh-per-pound metric improves because you’re cutting waste at the system level, not just the fixture level.
This three-layer framework, fixture efficiency, distribution efficiency, and system efficiency, is how experienced cultivation directors evaluate a lighting investment. Missing any layer means underestimating either the cost or the opportunity.
Grams per Watt vs. Grams per Kilowatt-Hour
Grams per watt (g/W) is a commonly used cultivation benchmark that compares harvested flower mass with installed lighting power. However, results are meaningful only when growers use consistent definitions of harvested mass, lighting wattage, and crop cycle.
For evaluating the energy efficiency of an entire cultivation operation, grams per kilowatt-hour (g/kWh) is often more useful because it measures output against electricity consumed over time.
Metric | Formula | Best use |
|---|---|---|
Grams per watt (g/W) | Harvested dry flower (g) ÷ installed lighting power (W) | Comparing results when crop-cycle and equipment definitions are consistent |
Grams per kilowatt-hour (g/kWh) | Saleable dry flower (g) ÷ measured electricity consumed (kWh) | Comparing energy productivity across operating periods |
Kilowatt-hours per pound (kWh/lb) | Electricity consumed (kWh) ÷ saleable dry flower (lb) | Tracking energy intensity and operating costs |
When comparing facilities, define whether the electricity measurement covers lighting alone or the entire operation, including HVAC, dehumidification, pumps, and other equipment.
A higher grams-per-watt result does not automatically mean a facility has lower electricity costs per pound. Use measured energy consumption and saleable crop output to assess the actual operating economics.
Practical recommendation: Track both a consistent cultivation yield metric and kWh per unit of saleable flower. This helps distinguish improvements in plant productivity from improvements in energy efficiency. For related guidance on environmental factors, check out the VPD management guide.
Flower Room Targets in Context
Flower rooms demand higher light intensity than vegetative spaces. Typical targets are 700 to 1,500 µmol/m²/s PPFD (depending on CO₂ levels), aiming for a daily light integral (DLI) of 35 to 50 mol/m²/day.
But there are diminishing returns. Higher PPFD linearly increases yield up to approximately 1,500 µmol/m²/s, but the cost curve is not linear when you factor in HVAC and CO₂. The dominant factor regulating the cost of crop lighting is the target canopy-level light intensity. Pushing from 1,000 to 1,500 µmol/m²/s might add 15% yield but can increase cooling and CO₂ costs by 30% or more.
This is exactly where cannabis lighting efficiency matters most. A fixture delivering 3.2 µmol/J hits the same PPFD target as a 1.7 µmol/J fixture while consuming roughly half the electricity and generating far less heat. The high-efficiency fixture makes aggressive DLI targets economically feasible rather than merely technically possible. For detailed PPFD and DLI planning, see the flower room lighting guide.
How to Improve Cannabis Lighting Efficiency in Your Facility
Practical steps, ranked roughly by impact:
Upgrade from HPS to LED. This single change typically delivers a 40 to 60% reduction in lighting energy consumption while reducing HVAC load.
Verify PPE claims with DLC-listed fixtures. If it’s not on the DLC Qualified Products List, treat the manufacturer’s efficiency claims with skepticism. DLC listing also unlocks rebates.
Optimize light placement and uniformity before increasing total wattage. Redistributing existing light often outperforms simply adding more fixtures. A proper lighting layout design is worth the engineering time.
Add under-canopy lighting. Capturing lower-canopy production with a targeted fixture is more efficient than cranking up top-light intensity to force photons through a dense canopy.
Consider centralized power. Moving drivers outside the grow room reduces in-room heat, simplifies maintenance, and can lower installation costs in large facilities.
Pursue utility rebates. DLC-listed fixtures qualify for incentives in most utility territories. These rebates can cover 30 to 50% of fixture cost, dramatically shortening payback.
Don’t ignore the environment. The best lights in the world can’t compensate for poor VPD, inconsistent fertigation, or bad canopy management.
Common Mistakes When Evaluating Cannabis Lighting Efficiency
Comparing fixtures on wattage instead of PPE. A 1,000W fixture is not “more powerful” than a 600W fixture if the 600W model delivers more photons per joule. Always compare µmol/J.
Chasing peak PPFD at the expense of uniformity. A fixture that delivers 1,500 µmol/m²/s at center but drops to 600 at the edges is less productive than one delivering a uniform 1,100 across the entire canopy. Hot spots cause stress. Dead zones waste space.
Ignoring the HVAC cost of inefficient lighting. Operators who calculate only the “light bill” when comparing fixtures undercount the true cost of inefficiency by 20 to 40%, because they’re not accounting for the cooling energy required to remove waste heat.
Buying non-DLC-listed fixtures and missing rebates. This is the most expensive mistake in percentage terms. Rebates are effectively free money that rewards choosing verified, efficient equipment.
Assuming more light always means more yield. Beyond a certain PPFD threshold (roughly 1,500 µmol/m²/s with CO₂), additional photons produce diminishing returns while costs continue to climb linearly.
Ready to Optimize Your Facility’s Lighting Efficiency?
Whether you’re planning a new build, retrofitting from HPS, or squeezing more grams per watt from an existing LED installation, the right lighting design starts with a conversation about your facility’s specific goals.
Schedule a free consultation with a lighting expert to discuss your efficiency targets, rebate eligibility, and lighting layout.
Frequently Asked Questions
What is a good PPE for cannabis grow lights in 2025?
The DLC Hort V4.0 minimum is 2.5 µmol/J, which serves as the baseline for any fixture worth considering. Good commercial LEDs deliver 2.8 to 3.0 µmol/J. Top-tier fixtures reach 3.2 to 3.6 µmol/J. Anything below 2.5 is now substandard and ineligible for most utility rebates.
How much electricity does it take to grow a pound of cannabis?
Typical commercial facilities consume between 2,000 and 3,000 kWh per pound of flower, with some less-efficient operations reaching 5,000 kWh per pound. Lighting accounts for approximately 40% of that total. In high-rate states, electricity costs alone can reach $300 to $500 per pound.
What is a good grams-per-watt target?
One gram per watt (1 g/W) is the practical benchmark most experienced growers use. Dialed-in LED operations with good environmental controls regularly hit 1.0 to 1.3 g/W. Elite facilities running CO₂ supplementation and precision fertigation can push 1.5 to 2.0 g/W.
Does LED lighting reduce HVAC costs?
Yes. LEDs convert a higher percentage of input energy into photons and a lower percentage into heat compared to HPS. This means less waste heat enters the grow room, reducing the cooling load on your HVAC system. Centralized power architectures extend this benefit further by relocating driver heat outside the grow space entirely.
Why does DLC certification matter for cannabis growers?
DLC listing is the standard most utility providers require before approving LED grow light rebates. The V4.0 threshold of 2.5 µmol/J also serves as a practical quality filter, ensuring that any listed fixture meets a verified minimum efficiency. Non-listed fixtures cost you twice: higher energy bills and missed rebate dollars.
Is it worth adding under-canopy lighting for efficiency?
A 2025 peer-reviewed study confirmed that subcanopy and inter-canopy lighting improves both yields and energy use efficiency. Rather than increasing top-light power to push photons through a dense canopy (which also increases heat and HVAC load), adding targeted light below the canopy captures production from lower bud sites at a fraction of the energy cost.
How close are LEDs to their maximum possible efficiency?
Current top-tier fixtures at 3.0+ µmol/J are approaching the physical limits of LED technology. Research from Utah State University puts the theoretical maximum for phosphor-converted white LEDs at about 76% electrical-to-photon conversion efficiency. This means future gains will be incremental at the chip level, and the bigger opportunities now lie in system design: light placement, uniformity, power architecture, and HVAC integration.
What’s the difference between PPE and PPFD?
PPE (µmol/J) measures fixture efficiency, how many photons a light produces per unit of electricity. PPFD (µmol/m²/s) measures light intensity at the canopy, how many photons land on a given area per second. A fixture can have excellent PPE but deliver poor PPFD at the canopy if it’s mounted too high, spaced incorrectly, or poorly designed optically. You need both metrics to make good decisions.