Cannabis Canopy Light Uniformity: 2026 Measurement Guide
Master cannabis canopy light uniformity in 2026—targets, PPFD mapping, mounting height, overlap, and under‑canopy lighting. Get the guide.
TL;DR
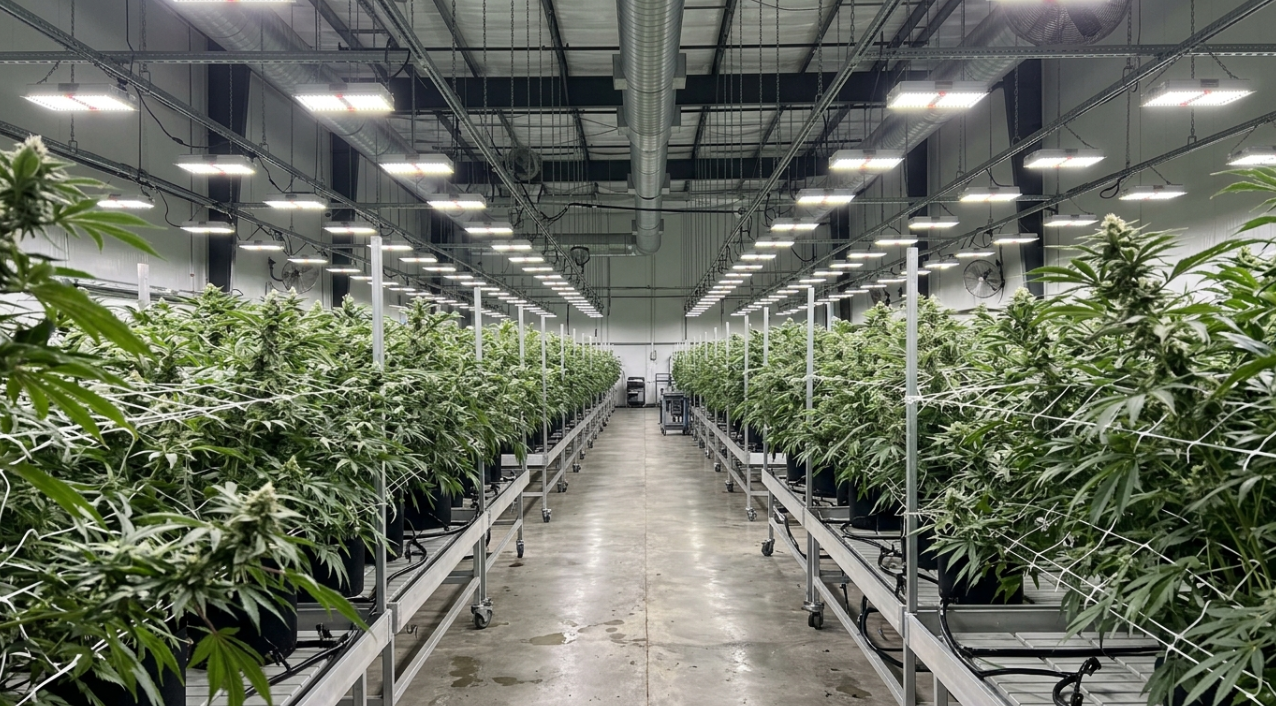
Cannabis canopy light uniformity measures how evenly light (PPFD) spreads across your growing area. The industry targets a uniformity ratio between 0.75 and 0.90, with a coefficient of variation below 15%. Poor uniformity can cost 10 to 30% of your yield and dramatically reduce cannabinoid and terpene consistency. Fixing it requires the right fixture type, proper mounting height, strategic overlap, reflective walls, and often under-canopy supplemental lighting.
Cannabis canopy light uniformity describes how evenly photosynthetic photon flux density (PPFD) is distributed across a growing area. Measuring uniformity helps commercial cultivators identify hot spots, dim corners, and inconsistent light exposure that may affect plant development, flower production, and crop consistency.
A fixture's peak PPFD rating does not reveal how evenly it illuminates an entire canopy. A high reading directly beneath a fixture can coexist with significantly lower readings between fixtures or along the edges of a grow room. Measuring the full canopy provides a more useful picture of actual lighting performance.
This guide explains how to measure cannabis canopy light uniformity, calculate uniformity ratios and coefficients of variation, interpret PPFD maps, and correct common distribution problems. It also covers fixture spacing, mounting height, reflective surfaces, and supplemental lighting strategies for commercial cultivation facilities.
If you're evaluating commercial cannabis LED lighting, understanding canopy uniformity can help you assess lighting designs beyond peak output and wattage specifications.
What Is Cannabis Canopy Light Uniformity?
Cannabis canopy light uniformity measures how evenly photosynthetic photon flux density (PPFD), expressed in µmol/m²/s, is distributed across the plant canopy. Growers measure it using a quantum sensor at multiple points across the growing area, then compare the minimum, average, and maximum readings. The uniformity ratio is calculated by dividing the minimum PPFD by the average PPFD, while the coefficient of variation (CV) measures the relative spread of all readings. Higher uniformity generally indicates fewer extreme differences in light exposure, although the appropriate target depends on the lighting design and growing conditions.
What Cannabis Canopy Light Uniformity Actually Means
In plain terms, canopy light uniformity describes how evenly photosynthetic photon flux density (PPFD) is distributed across the growing area at canopy height. A perfectly uniform canopy would mean every plant, from center to edge, receives the same number of usable photons per second. That’s physically impossible, but the gap between “perfect” and “good enough” is where yield and quality live.
Most growers already track average PPFD. Uniformity forces you to care about the minimum and the maximum too, and about the spread between them.
There are actually two dimensions to this concept that most guides ignore.
Horizontal Uniformity
This is the classic definition: how evenly light is distributed across the canopy surface, from one side of the room to the other. It’s what you measure with a PAR map grid. Hot spots under fixtures and dim corners are horizontal uniformity problems.
Vertical Uniformity
This is the light gradient from the top of the canopy down to the lower branches. Cannabis plants are tall, and a dense canopy can block 90% or more of incoming light before it reaches the bottom third. Research by Danziger and Bernstein (2021) found that cannabinoid concentrations in lower inflorescences correlate directly with low light penetration. Vertical uniformity is the specific problem that under-canopy and inter-canopy supplemental lighting addresses.
If you only measure at the canopy top, you’re seeing half the picture.
Cannabis Canopy Light Uniformity Metrics
Three useful metrics help growers evaluate the distribution of PPFD across a canopy. Each measures a different aspect of uniformity, so they should be interpreted together rather than treated as interchangeable.
Metric | Formula | What It Measures | How to Interpret It |
|---|---|---|---|
Uniformity ratio | Minimum PPFD ÷ Average PPFD | How far the dimmest measured point falls below the average | Higher values indicate better minimum coverage |
Coefficient of variation (CV) | (Standard deviation ÷ Mean PPFD) × 100 | Relative variability across all measured points | Lower values indicate a tighter distribution |
Maximum-to-minimum ratio | Maximum PPFD ÷ Minimum PPFD | The spread between the brightest and dimmest points | Values closer to 1 indicate a smaller spread |
A uniformity ratio of 0.80 means the minimum reading is 80% of the average PPFD. A CV of 15% means the standard deviation equals 15% of the mean. Neither figure alone describes every aspect of the distribution, so reviewing the full PPFD map is important.
Uniformity targets should be established during lighting design and verified after installation. A ratio of 0.75 or higher and a CV below 15% can serve as preliminary design goals, but these are not universal industry requirements. The final acceptance criteria should reflect the facility's specifications, crop requirements, and measurement method.
Uniformity Ratio (Emin/Eavg)
The most commonly cited metric. You divide the lowest PPFD reading on your grid by the average of all readings. A ratio of 0.85 means your dimmest spot receives 85% of the average intensity. Industry targets sit between 0.75 and 0.90, with anything below 0.75 signaling a layout that needs redesign.
Coefficient of Variation (CV)
CV expresses variability as a percentage of the mean: take the standard deviation of all your PPFD readings, divide by the mean, and multiply by 100. A CV below 15% is the accepted commercial threshold. This metric is more sensitive than the uniformity ratio because it accounts for the full spread of readings, not just the minimum.
PPFD Variance from Mean
The simplest check. How far does any single reading deviate from the average? Runkle (2017) at Michigan State suggested 10 to 20% variation is generally acceptable, though some researchers have argued that ±5% is the more appropriate target for precision environments like plant factories.
For a deeper look at the relationship between PPFD, DLI, and how these measurements interact with your overall lighting plan, see this cannabis PPFD guide.
How to Measure Cannabis Canopy Light Uniformity Step by Step
Measuring cannabis canopy light uniformity requires a calibrated quantum sensor, a consistent measurement grid, and readings taken under representative operating conditions. Follow these steps to create a PPFD map and identify areas that may need lighting adjustments.
Step 1: Prepare the Lighting Environment
Turn on the lighting system and allow it to stabilize according to the manufacturer's instructions. Record the fixture model, mounting height, dimmer setting, photoperiod, and any supplemental lighting that is operating.
For indoor facilities, measure under the lighting conditions you want to evaluate. If you are measuring supplemental lighting separately, document that configuration so the results can be compared accurately.
Step 2: Establish a Measurement Grid
Divide the growing area into a grid of evenly spaced measurement points. Include the center, the areas between adjacent fixtures, the edges, and the corners.
A small test area may need only a basic grid, while a large commercial room generally requires more points to capture differences across the entire canopy. Increase the sampling density around suspected hot spots, dark zones, and transitions between fixture footprints.
Step 3: Measure at Actual Canopy Height
Place the sensor at the height of the canopy surface being evaluated. Keep the sensor level and orient it consistently at every point.
For an uneven canopy, measure representative high and low areas separately or record the canopy height at each location. Do not assume that measurements taken at the fixture level or on the floor represent the light reaching the plants.
Step 4: Record Every PPFD Reading
Measure and record PPFD at each grid point in µmol/m²/s. Avoid shading the sensor with your body, and follow the sensor manufacturer's guidance for positioning and measurement technique.
Use the same instrument, orientation, and operating conditions throughout the map. If you compare separate measurements, record any changes in dimming, fixture position, or supplemental lighting.
Step 5: Calculate Uniformity Metrics
Calculate the average PPFD, minimum PPFD, maximum PPFD, and standard deviation from the recorded measurements.
Use the following formulas:
Uniformity ratio = Minimum PPFD ÷ Average PPFD
Coefficient of variation = (Standard deviation ÷ Average PPFD) × 100
Maximum-to-minimum ratio = Maximum PPFD ÷ Minimum PPFD, when the minimum is greater than zero
These calculations help you assess the overall distribution and identify whether the dimmest locations are substantially below the average.
Step 6: Review the PPFD Map
Plot the readings on a floor plan or use a heat map to visualize where light is concentrated and where it falls off.
Look for repeated patterns, such as bright areas directly below fixtures, dark strips between fixtures, weak edge coverage, or isolated low readings. Compare the map with your intended lighting design and crop-stage intensity requirements.
Step 7: Correct the Layout and Measure Again
Depending on the pattern, consider adjusting fixture height, spacing, alignment, or dimming, or evaluating supplemental lighting. Make one controlled adjustment at a time when practical, then repeat the measurements under comparable conditions.
Keep the original and revised maps so you can verify whether the adjustment improved uniformity without creating new hot spots or pushing average PPFD outside the intended range.
A documented PPFD map turns lighting adjustments into a measurable commissioning process rather than a visual guess.
Spectral Uniformity: The Hidden Variable
Almost no one talks about this, but it matters. If your fixtures use multi-chip colored LED arrays (separate red, blue, and white diodes), the spectral ratio can shift across the canopy depending on viewing angle and distance. One bench position might get a heavier red ratio while another skews blue.
Research on photon irradiance distribution shows that uneven distribution of specific wavebands drives differences in biomass and crop quality. Full-spectrum white light fixtures, built on broadband phosphor conversion, inherently deliver more consistent spectral distribution across the footprint because the spectrum comes from a single phosphor layer rather than from mixing discrete colored diodes at varying angles.
Why Uniformity Matters: The Business Case
This is not an academic exercise. Poor cannabis canopy light uniformity has measurable financial consequences.
Yield Losses of 10 to 30%
The math is straightforward. A commercial rule of thumb, validated by Marcelis et al. (2006) across roughly 100 academic papers and 90 commercial growers, holds that a 1% sustained increase in PPFD (and therefore DLI) produces approximately a 1% increase in plant growth and yield. When parts of your canopy sit 30% below the average PPFD, those plants underperform by a corresponding margin.
Estimates of yield reduction from poor uniformity range from 10 to 30%, with the largest losses occurring when a hard quality acceptance threshold is applied, meaning any flower below a grade cutoff becomes trim or waste.
Cannabinoid and Terpene Inconsistency
A 2025 study by Garrido et al. tested supplemental canopy lighting (both sub-canopy and inter-canopy) and found that these strategies reduced the coefficient of variation for inflorescence yields by 55 to 62%, cannabinoid yield variability by over 50%, and total terpene yield variability by 75%. The result was a more standardized product with more consistent chemical profiles.
For medical cannabis producers, this consistency is not optional. Patients and regulators expect predictable potency from batch to batch. Even in recreational markets, strain-specific terpene profiles are a brand differentiator that uneven lighting quietly erodes.
The cannabis flower room lighting guide covers how to set intensity targets that pair with uniformity planning.
The Sorting and Labor Tax
When uniformity is poor, harvest crews pull wildly different flower quality from different parts of the same room. Some colas are dense and resinous, others are airy and underdeveloped. That means more sorting labor, more trim, lower average grade, and more time spent explaining variation to buyers or compliance officers.
The HVAC Ripple Effect
This connection gets almost no attention, but it is real. Uneven light creates uneven canopy temperature. Hot spots under fixtures drive higher leaf temperature and faster transpiration in some zones while cooler edges transpire less. Your HVAC system then fights to maintain a single setpoint across a room that is generating heat and moisture at different rates in different places.
The result is localized humidity spikes, increased botrytis risk in cool pockets, and an environmental control system that’s always chasing. For more on sizing HVAC around your lighting layout, see this guide on HVAC for LED grow lights. Moving heat sources out of the grow space (through centralized power architectures, for instance) can reduce this thermal variance at the canopy level.
What Causes Poor Uniformity
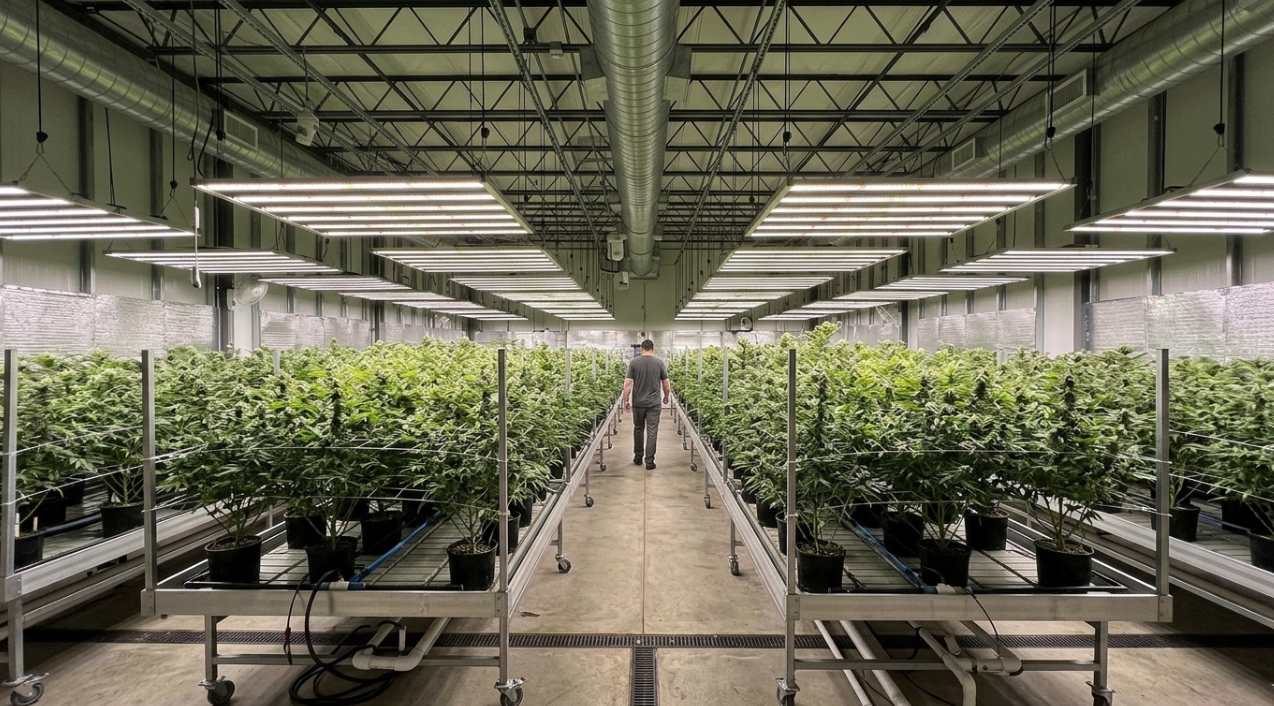
Understanding the causes is half the fix. These are the most common culprits in commercial cannabis grows.
Fixtures Hung Too Low
A room averaging 900 µmol/m²/s with a hotspot at 1,400 directly under the fixture and corners at 400 will show light stress in the center and stretch at the edges simultaneously. As hang height increases, PPFD values decrease but become more uniform. There’s always a tradeoff, and many growers err too far toward intensity.
Panel-Style Fixtures in Large Rooms
Traditional panel or box-style LED fixtures concentrate output in a narrow cone. This creates intense peaks under each unit with steep falloff between them. Linear bar-style fixtures produce a wider, more diffuse beam pattern that makes overlapping coverage easier without creating severe hot spots.
Missing Edge and Corner Coverage
Walls absorb photons. If your outermost fixtures are positioned the same distance apart as your interior fixtures, edge plants will be underserved. This is one of the most common layout mistakes in commercial rooms, and it’s completely preventable with either tighter edge spacing or high-reflectivity wall finishes.
Canopy Height Changes During Flower
Cannabis stretches. A lot. The PAR map you validated in week one of flower may be meaningless by week three as the canopy rises 12 to 18 inches closer to the fixtures. Unless you re-map or adjust fixture height, your uniformity degrades as the crop grows.
Design-to-Install Variance
No ranking page on this topic addresses a critical real-world problem: the gap between what a lighting plan promises on screen and what the installed room actually delivers. Fixture mounting tolerances, ceiling obstructions, dimmer calibration, and wiring differences all introduce variance. A design tool might show 0.85 uniformity, but if the install delivers 0.70, you’ve got a problem that doesn’t show up until the first harvest disappoints.
This is why tight design-to-install PPFD accuracy matters. A variance of ±5% between the modeled plan and the commissioned room is achievable with good engineering but requires discipline at every step from layout to final commissioning.
Cannabis Canopy Light Uniformity Troubleshooting Guide
Use the PPFD map to identify the distribution pattern before changing the lighting system. Similar symptoms can have different causes, so confirm the readings before choosing a corrective action.
PPFD Map Pattern | Possible Cause | Recommended Check |
|---|---|---|
High readings directly beneath fixtures | Fixtures too close to the canopy or concentrated output | Check mounting height, optics, and dimmer settings |
Low readings between fixtures | Insufficient overlap or excessive fixture spacing | Review fixture spacing and photometric coverage |
Low readings along the outer edges | Insufficient perimeter coverage or reflective losses | Review edge fixture placement and wall reflectance |
One isolated dark zone | Obstruction, fixture fault, or misalignment | Inspect the fixture, mounting position, and obstructions |
Uniformity changes as plants grow | Canopy height or shape has changed | Repeat measurements at the new canopy height |
Measured values differ significantly from the lighting plan | Installation tolerances, incorrect assumptions, or measurement differences | Verify sensor calibration, fixture settings, mounting positions, and model assumptions |
Top canopy is well lit but lower foliage receives little light | Vertical light penetration is limited | Evaluate canopy structure and supplemental inter-canopy or sub-canopy lighting |
Do not increase total light output simply because one area has a low reading. First determine whether the problem is insufficient average PPFD, uneven distribution, or a combination of both. The correction should address the actual cause while preserving appropriate intensity across the canopy.
How to Achieve and Maintain Cannabis Canopy Light Uniformity
Choose Fixtures Based on Their Light Distribution
Fixture selection affects how evenly PPFD reaches the canopy, but no single fixture shape guarantees superior uniformity in every grow room. Linear bar-style fixtures can provide useful overlap across rectangular benches, while other fixture designs may also deliver even coverage when correctly engineered and positioned.
When comparing commercial cannabis LED fixtures, review the published PPFD distribution map, average PPFD, minimum readings, mounting height, and tested coverage area. Check whether the map reflects the intended installation geometry and operating settings.
A fixture's peak PPFD rating is not enough to evaluate coverage. Compare how the light is distributed across the entire intended canopy, including edges and spaces between fixtures.
See commercial bar-style LED fixtures for an example of the type of product information to review when assessing a lighting system.
Optimize Mounting Height and Fixture Spacing
Mounting height and spacing should be evaluated together. Increasing the distance between a fixture and the canopy often spreads light over a larger area, reducing some hot spots but also lowering intensity. Fixture optics and neighboring light sources affect the final distribution.
Use the manufacturer's photometric data or a lighting simulation as the starting point for layout decisions. Then verify the installed system using a PPFD map at the actual canopy height.
Rather than treating a fixed spacing-to-height ratio as a universal rule, compare alternative layouts using the same measurement area, fixture output, and target intensity. Select the configuration that provides suitable coverage without excessive peaks or unacceptable low-light zones.
For additional background, see the greenhouse light spacing guide.
Overlap Fixture Footprints by 20 to 50%
Adjacent fixtures should share coverage zones. Overlapping footprints by 20 to 50% softens beam transitions and reduces the gap between maximum and minimum PPFD readings. If you can see a hard shadow line between two fixtures at canopy height, your overlap is insufficient.
Use High-Reflectivity Wall Surfaces
Maintaining wall reflectivity above 90% (using elastomeric white paint or specialized reflective panels) bounces escaping photons back into the edges of the canopy. This is one of the cheapest uniformity improvements available and is especially effective for edge and corner plants.
Dim for Intensity, Adjust Height for Distribution
This is a practitioner insight that shows up consistently in grower forums. Dimming changes intensity while preserving the light distribution pattern. Changing height changes both intensity and distribution. If your uniformity is acceptable but your average PPFD is too high, dim first. If your uniformity needs work, adjust height. Conflating the two adjustments is a common mistake.
Validate with a PAR Map
Accurate PPFD measurement requires a quantum sensor, not a lux meter. Lux meters weight wavelengths for human vision and consistently underreport the red-heavy spectra that plants use most. The two most trusted calibrated instruments are the LI-COR LI-190R and the Apogee SQ-500. Build a 9 to 16 point grid at actual canopy height (not at the fixture face) and aim for ±10 to 15% variation.
Experienced growers on forums like 420 Magazine recommend plotting data in Excel surface charts to visualize hot spots and cold zones. Re-map after major canopy changes, defoliation events, or any fixture repositioning. For a full measurement walkthrough, see how to measure PPFD.
Improve Vertical Light Distribution with Canopy-Level Measurements
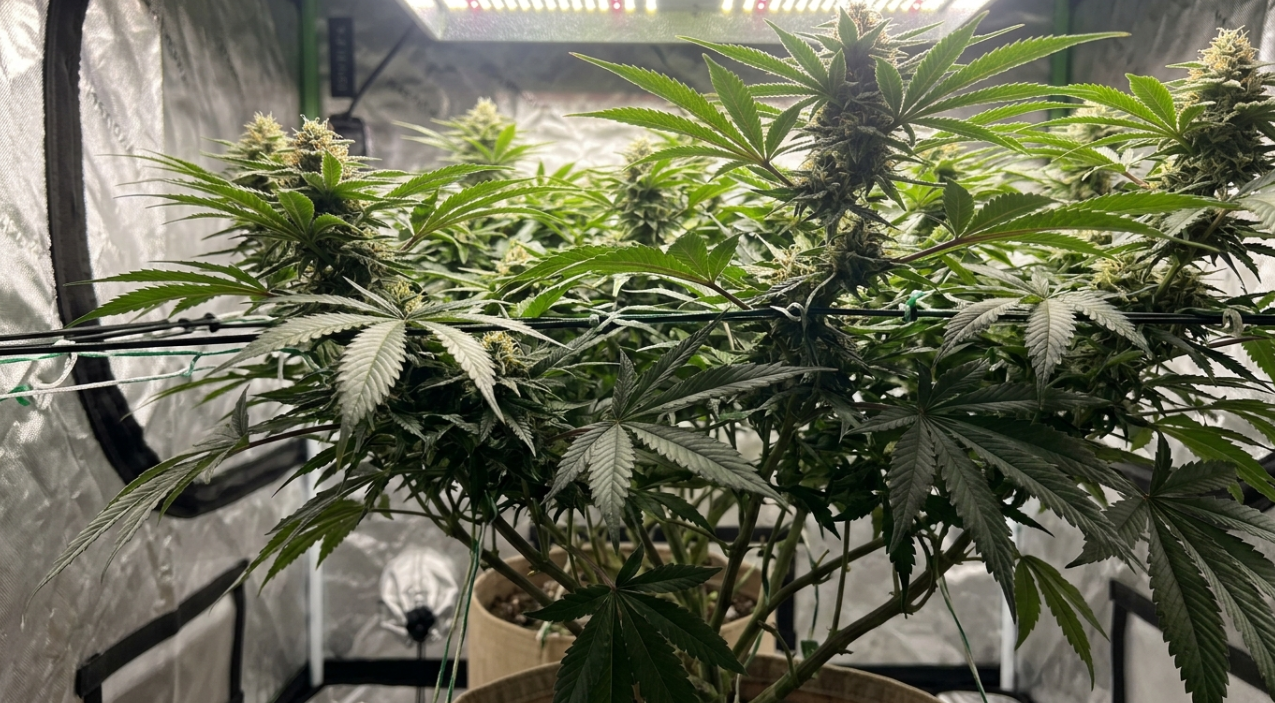
Horizontal uniformity describes the distribution of light across the canopy surface. Vertical light distribution describes how light exposure changes from the upper canopy to the middle and lower portions of the plant.
A PPFD map taken only at the top of the canopy cannot describe the light environment throughout the plant. Leaves, branches, plant density, and canopy architecture affect how much light reaches lower positions.
To evaluate vertical distribution, measure PPFD at representative heights within the canopy using a consistent method. Record the measurement height and sensor orientation, and compare results across locations. Measurements at different heights should be interpreted separately from a horizontal canopy map because they represent different sampling planes.
Depending on the crop architecture and production goals, possible responses include managing canopy density, improving light penetration, or evaluating supplemental inter-canopy and sub-canopy lighting.
A 2025 medicinal cannabis study found that both inter-canopy and sub-canopy supplemental lighting improved within-plant light distribution and increased dry inflorescence yield under the tested conditions. The results support evaluating supplemental lighting as one possible strategy, but the benefits and energy requirements should be assessed for each facility. <Cite refs={["turn782220search1","turn782220search2"]}/>
Learn more about under-canopy lighting and consult the under-canopy LED lighting guide for further information about system configurations.
Supplemental lighting should be assessed using both production results and energy consumption. Additional fixtures can increase electrical demand, so the relevant question is whether the improvements in marketable production and consistency justify the added operating cost.
Pulling It All Together
Cannabis canopy light uniformity is not a single fix. It is the outcome of getting multiple variables right simultaneously: fixture choice, mounting geometry, overlap, wall treatment, canopy management, and supplemental lighting. Each lever you pull improves the distribution, and the compounding effect of getting several right is where the real performance gains appear.
The growers who treat uniformity as a design constraint from day one, rather than a problem to troubleshoot after the first disappointing harvest, consistently produce more consistent flower at lower per-gram cost.
If you’re building a new room or rethinking your current layout, schedule a free lighting consultation to see what uniformity numbers are achievable for your specific space.
Frequently Asked Questions
What is a good uniformity ratio for cannabis?
A uniformity ratio (Emin/Eavg) between 0.75 and 0.90 is the accepted commercial target. Below 0.75, yield losses become measurable and your layout likely needs redesign. Above 0.90 is excellent and typically requires bar-style fixtures with proper overlap and reflective walls.
Can I measure light uniformity with a lux meter?
No. Lux meters are calibrated for human vision and underreport red wavelengths that are critical for photosynthesis. You need a quantum sensor (PAR meter) like the Apogee SQ-500 or LI-COR LI-190R to get accurate PPFD readings for uniformity mapping.
How many measurement points do I need for a PAR map?
A minimum of 9 points (3×3 grid) for a small space, 16 points (4×4) for a standard commercial room. More points give a more accurate picture. Measure at actual canopy height, not at the fixture or at the floor.
Does fixture height affect uniformity more than dimming?
Yes. Raising fixture height changes both intensity and distribution, spreading light over a wider area and improving uniformity. Dimming changes intensity while preserving the existing distribution pattern. Use height to fix uniformity, dimming to fine-tune intensity.
How much yield can poor light uniformity cost?
Estimates range from 10 to 30% depending on the severity of the non-uniformity and whether the operation applies strict quality grading. Even at the low end, 10% yield loss in a commercial flower room represents significant revenue.
What is vertical light uniformity and why does it matter for cannabis?
Vertical uniformity describes the light gradient from the canopy top to the lower branches. Cannabis plants are tall, and dense canopies can block 90% or more of incoming light. Lower inflorescences that receive insufficient light produce dramatically lower cannabinoid and terpene concentrations. Under-canopy supplemental lighting is the primary tool for improving vertical uniformity.
How often should I re-map my PPFD after the initial measurement?
Re-map after any major canopy change (defoliation, flower stretch), fixture repositioning, or dimmer adjustment. At minimum, map at the start of each flower cycle and again around week three when stretch has peaked.
Do reflective walls really make a difference for uniformity?
Yes. Walls with reflectivity above 90% redirect photons that would otherwise be absorbed back into the canopy edges. For edge and corner plants, this can be the difference between adequate and deficient PPFD. It is one of the lowest-cost uniformity improvements available.
Related Terms
PPFD (Photosynthetic Photon Flux Density): The number of photosynthetically active photons hitting a surface per second per square meter.
DLI (Daily Light Integral): Total photosynthetic photons received per square meter over a 24-hour period. See the cannabis DLI guide.
PAR (Photosynthetically Active Radiation): The range of light wavelengths (400 to 700 nm) that plants use for photosynthesis.
PPF (Photosynthetic Photon Flux): Total photon output from a fixture, measured in µmol/s. See PPF vs PPFD explained.
Uniformity Ratio: Emin/Eavg, the ratio of minimum to average PPFD across a measurement grid.
Coefficient of Variation (CV): Standard deviation of PPFD divided by the mean, expressed as a percentage.