How to Measure PPFD in Greenhouse: 2026 Complete Guide
Learn how to measure PPFD in greenhouse accurately using a PAR meter, grid mapping, and DLI math. Get 2026 tips, steps, and formulas—start now.
TL;DR
PPFD (Photosynthetic Photon Flux Density) measures the number of light photons hitting a square meter of plant canopy every second, expressed in µmol/m²/s. To measure PPFD in a greenhouse accurately, you need a quantum PAR meter, a grid-based measurement protocol at canopy level, and a method to separate sunlight from supplemental lighting. Greenhouse measurement is more complex than indoor grows because you must account for glazing transmission losses, sunlight variability, and light uniformity across the entire growing area.
What Is PPFD and Why It Matters in a Greenhouse
PPFD stands for Photosynthetic Photon Flux Density. It measures the number of photons, specifically those in the 400 to 700 nanometer wavelength range, that land on one square meter of surface every second. The unit is µmol/m²/s (micromoles per square meter per second), where one micromole equals roughly 62 quadrillion photons.
Think of PPFD as the “speedometer” of plant lighting. It tells you how much usable light is arriving at your crop canopy right now, in this moment. That matters because photosynthesis is driven by photon count in the PAR range, not by how bright light appears to human eyes.
Before going further, two distinctions that trip people up constantly:
PAR is not a measurement. PAR (Photosynthetically Active Radiation) defines a type of light, the wavelengths between 400 and 700 nm that plants use for photosynthesis. It is not a metric like feet or kilograms. When someone says “measure the PAR,” they almost certainly mean “measure the PPFD.”
PPF is not the same as PPFD. PPF (Photosynthetic Photon Flux) measures the total PAR output from a light source, in all directions. PPFD measures how much of that light actually arrives at a specific point. PPF is what a light emits; PPFD is what a plant receives. For greenhouse growers making decisions about crop performance, PPFD is the number that matters.
Talk to a lighting expert about the right PPFD levels for your greenhouse operation.
Why Lux and Lumens Are the Wrong Metrics for Greenhouses
If you already own a lux meter or foot-candle meter, you might be tempted to use it. Don’t, at least not for any decision that involves real money.
Lux and lumens measure light as the human eye perceives it, weighted heavily toward green-yellow wavelengths where our vision is most sensitive. The problem is that plants care most about blue (400 to 500 nm) and red (600 to 700 nm) light, the exact wavelengths that lux meters undercount. Industry testing has shown that 500 lux from pink LEDs delivers 72% more usable PAR than the same lux reading from white LEDs. Same number on the meter, wildly different photosynthetic value.
Online lux-to-PPFD calculators exist, but the conversion factor changes dramatically depending on the light source. The factor for sunlight is different from HPS, which is different from various LED spectra. Using a converted lux reading to control your supplemental lighting can lead to either starving your crop of light or wasting energy on the wrong kind.
The horticulture industry settled this question formally. ANSI/ASABE S640, the standard for electromagnetic radiation quantities in plant science, codifies PPFD and DLI as the correct metrics for greenhouse lighting. Photometric units like lumens simply do not apply. For more on why this distinction matters when comparing LEDs to HPS, the spectral differences make lux comparisons especially misleading.
What You Need to Measure PPFD in a Greenhouse
Quantum PAR Meters (The Standard)
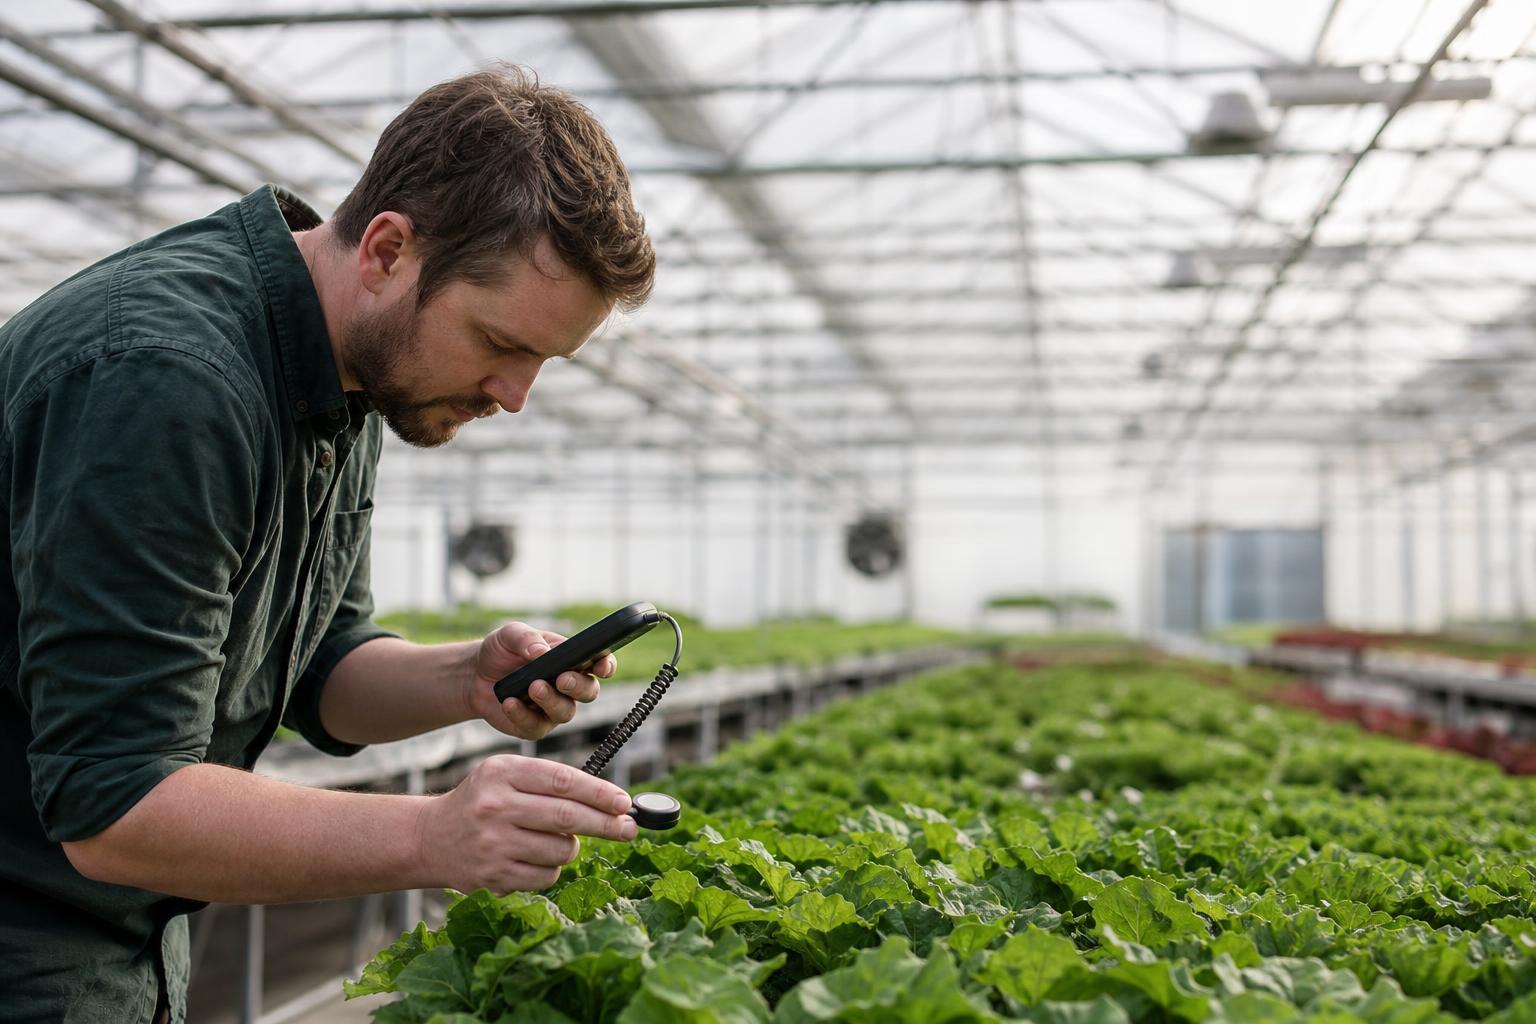
A quantum PAR meter uses a sensor calibrated to count photons in the 400 to 700 nm range. This is the only tool that directly measures PPFD in µmol/m²/s.
When choosing a meter, look for three things:
-
Cosine correction. Greenhouse light arrives from many angles, not just straight down. Sunlight moves across the sky, reflects off walls and surfaces, and enters through glazing at oblique angles. A cosine-corrected sensor accurately weights photons arriving from different directions, which matters enormously in a greenhouse environment.
-
Data logging capability. A single PPFD reading is a snapshot. In greenhouses, where sunlight changes minute by minute, the ability to log readings over time lets you calculate DLI and track patterns. Wireless data-logging meters can automate uniformity studies and export data for quality control.
-
Spectral accuracy across source types. Your meter needs to read both sunlight and LED spectra accurately, since greenhouses use both simultaneously.
According to MSU Extension researcher Roberto G. Lopez, light meters suitable for most greenhouse applications start around $300 and can run up to $1,000. For commercial operations where lighting decisions involve thousands of dollars in fixtures and crop value, a professional quantum sensor is the clear choice.
Extended PAR (ePAR) Meters
ePAR meters measure a wider range, typically 380 to 760 nm, capturing UV and far-red wavelengths that some crops can use. As research on far-red’s role in morphology and flowering expands, these meters are becoming more relevant for certain greenhouse applications.
Phone Apps: When They Work and When They Don’t
Smartphone apps that estimate PPFD using the phone’s ambient light sensor have become popular, and testing shows genuinely mixed results.
Apps like Photone and PPFD Meter tend to be fairly accurate on iPhones, largely because the iPhone front camera has consistent spectral sensitivity across models. Under full-spectrum white light, most apps perform reasonably well. The accuracy drops sharply, however, when measuring narrow-spectrum LED fixtures, the type with heavy red and blue output. The phone’s ambient light sensor does not respond to different wavelengths the way a proper cosine-corrected quantum sensor does.
Practitioners on grower forums offer a pragmatic take. One experienced grower on Rollitup who owns a professional-grade quantum meter noted that “most personal growers are a lot better off spending $35 on a Uni-T than they are spending $$ on an Apogee,” arguing that the law of diminishing returns kicks in hard for hobbyists. That’s reasonable advice for someone growing a few plants at home. But for a commercial greenhouse where a lighting mistake means lost crop revenue, a calibrated quantum sensor pays for itself on the first decision it informs.
How to Measure PPFD in a Greenhouse: Step-by-Step
This is where greenhouse measurement diverges from indoor growing. In a sealed grow room, the light environment is stable and fully artificial. A greenhouse mixes variable sunlight with supplemental fixtures, filtered through glazing materials that degrade over time. The measurement protocol has to account for all of this.
Step 1: Determine Your Greenhouse’s Light Transmission
Before you measure PPFD at the canopy, you need to know how much outdoor light your greenhouse actually lets through. Glazing materials, whether glass, polycarbonate, polyethylene film, or acrylic, absorb and reflect a percentage of incoming PAR.
To measure transmission:
- Place a calibrated PAR meter outside the greenhouse in direct sunlight and record the reading.
- Simultaneously (or as close to simultaneously as possible), take a reading inside the greenhouse at the same height, directly below the glazing.
- Divide the internal reading by the external reading and multiply by 100.
Example: If the outdoor PPFD reads 1,200 µmol/m²/s and the indoor reading is 840, your transmission is 70%.
New, clean glazing materials typically transmit 60 to 80% of incoming PAR. Single-pane clear glass runs around 88 to 91%. Double-wall polycarbonate drops to about 80%. But here’s the catch that many growers miss: measured at canopy level, actual PAR delivery is often only 40 to 60% of what’s available outside, because structural elements, hanging baskets, equipment, and dirt all block light.
And transmission drops over time. A greenhouse that transmitted 70% of PAR when new might transmit 55% three years later. Growers who sized their supplemental lighting based on new-glazing performance find themselves underdelivering light without realizing it. Rechecking transmission at least annually, especially before winter, is worth the effort.
For a deeper walkthrough on connecting these numbers to DLI greenhouse calculations, the formula-based approach makes the deficit calculation much more precise.
Step 2: Measure at Canopy Level Using a Grid Pattern
A single PPFD reading at the center of your bench tells you almost nothing useful. Light distribution is uneven in every greenhouse, influenced by fixture placement, structural shadows, bench orientation, and the angle of incoming sunlight.
The correct approach is a grid measurement:
- Set up a grid of measurement points across your growing area. Spacing depends on fixture mounting height, but a grid of 12 to 24 inches between points works for most greenhouse benches.
- Hold or mount the sensor at canopy level, where the top leaves are. Light intensity drops rapidly with distance from the source, so measuring at the wrong height gives misleading numbers.
- Record readings at every grid point: center, corners, edges, and positions in between.
The tighter the grid, the more accurately you capture hot spots under fixtures and dark zones between them or along walls. For large greenhouses, focus on representative sections rather than trying to map the entire facility at once.
Step 3: Measure Supplemental Lights Separately (At Night)
This is a step many growers skip, and it leads to confusion about what their fixtures actually contribute versus what sunlight provides.
To isolate supplemental light output, take your grid measurements at night with only the supplemental fixtures running. No sunlight interference, no cloud variability. This gives you a clean map of what your lighting system delivers on its own.
For greenhouse operators evaluating whether their current fixtures are meeting crop needs, this nighttime measurement is the baseline for deciding whether to add, replace, or reposition fixtures. The Altus 1K top light is designed specifically for this greenhouse supplemental role, and nighttime PPFD mapping is how you verify that any fixture is performing to spec in your actual installation.
Step 4: Account for Sunlight Variability
Greenhouse PPFD is not static. It changes with time of day, season, cloud cover, and even the ratio of direct to diffuse sunlight.
A few things to keep in mind:
- When the sun is high in the sky (summer midday), you get more PAR per unit of solar energy than when the sun is low (winter, early morning, late afternoon). This means the same “sunny day” produces different PPFD depending on season.
- Cloudy days actually have a higher PAR-per-joule ratio than clear days, because clouds filter out more infrared and UV than PAR wavelengths. But total PPFD is still much lower on cloudy days.
- Light entering at steep angles through the glazing suffers more reflection loss than light entering close to perpendicular.
For accurate DLI calculations, you either need to take PPFD readings at multiple times throughout the day and integrate them, or use a data-logging meter that records continuously. Historical solar radiation data from local weather stations can supplement your measurements, especially for seasonal planning.
Step 5: Calculate DLI and Determine Supplemental PPFD Needs
PPFD is a snapshot. DLI (Daily Light Integral) is the sum of all those snapshots across a full day, telling you the total number of photosynthetically active photons delivered to one square meter in 24 hours. DLI is expressed in mol/m²/d.
The conversion formula:
DLI = PPFD × photoperiod (hours) × 3,600 ÷ 1,000,000
To work backward from a DLI target to the PPFD you need:
PPFD = DLI × 1,000,000 ÷ (photoperiod in hours × 3,600)
Here’s a practical example. A lettuce grower in Ohio needs a DLI of 17 mol/m²/d. In January, the greenhouse receives only 8 mol/m²/d after transmission losses. The deficit is 9 mol/m²/d. If the grower runs supplemental lights for 16 hours, the required supplemental PPFD is:
9 × 1,000,000 ÷ (16 × 3,600) = 156 µmol/m²/s
That number tells the grower exactly what supplemental intensity they need and lets them spec the right fixtures and fixture spacing. For more detail on this calculation, the greenhouse PPFD calculator walks through the full workflow with additional crop examples.
Measuring PPFD Uniformity: The Step Most Growers Skip
Taking grid measurements is only half the job. The other half is evaluating how uniform those readings are across the growing area. This is where commercial growers separate from hobbyists, and where real money is at stake.
Two metrics matter:
Coefficient of Variation (CV): CV = (standard deviation of all PPFD readings ÷ mean PPFD) × 100. A CV below 15% is the accepted commercial threshold. Above that, you have meaningful hot spots and dark zones that will show up as uneven crop growth.
Uniformity Ratio (Emin/Eavg): Divide the lowest recorded PPFD by the average. Industry targets sit between 0.75 and 0.90. If your minimum reading is 200 µmol/m²/s and your average is 400, your ratio is 0.50, which means your weakest plants are getting half the light of your average plants.
The economic impact is severe. Research on photon irradiance and crop commercial value shows that when a hard quality acceptance threshold is applied at 80% of target PPFD, the difference between two lighting installations can shift crop yield utilization from 99% to 46%. In plain terms, poor uniformity can cut your usable yield nearly in half.
One more thing about uniformity: be skeptical of manufacturer PPFD maps. Many brands publish maps generated in reflective testing environments or with insufficient measurement points, creating expectations that don’t match real-world installations. Always verify with your own measurements in your actual greenhouse. For context on what reliable lighting specs should look like, a horticulture lighting facts label provides a framework for honest performance reporting.
PPFD Targets by Crop
Once you know how to measure PPFD in a greenhouse, you need reference points. These ranges represent widely cited targets from university extension research and commercial practice:
| Crop | PPFD Range (µmol/m²/s) | DLI Target (mol/m²/d) |
|---|---|---|
| Lettuce, leafy greens, herbs | 200 to 400 | 12 to 17 |
| Tomatoes | 400 to 800+ | 20 to 35 |
| Peppers | 400 to 600+ | 20 to 30 |
| Cucumbers | 400 to 600 | 20 to 30 |
| Cannabis (seedling) | 100 to 300 | varies |
| Cannabis (vegetative) | 300 to 600 | varies |
| Cannabis (flower) | 600 to 1,000+ | 35 to 65+ |
These are starting points, not absolute prescriptions. Cultivar, CO2 supplementation level, temperature, and growth stage all influence optimal PPFD. A tomato grower pushing CO2 to 1,000 ppm can use more light productively than one growing at ambient CO2 levels.
For crop-specific deep dives, see the guides on lettuce lighting requirements and cannabis PPFD targets by growth stage.
Common Mistakes When Measuring PPFD in a Greenhouse
1. Using a lux meter as a PAR substitute. The spectral mismatch between human vision and plant photosynthesis makes lux readings unreliable for lighting decisions, especially under LEDs.
2. Taking a single center reading. One reading under the brightest point hides underlit edges and corners. A grid is the minimum standard.
3. Measuring during the day without isolating supplemental light. If you want to know what your fixtures contribute, measure at night. Daytime readings blend sunlight and fixture output in ways that are impossible to separate from a single measurement.
4. Ignoring glazing age and dirt. Transmission drops year over year. Dirty or aging glazing steals light silently. Measure transmission annually.
5. Forgetting cosine correction. Phone sensors and cheap meters are highly directional. In a greenhouse, where light arrives from the sun at constantly changing angles and bounces off every surface, a non-cosine-corrected sensor will consistently misread.
6. Trusting manufacturer PPFD maps without verification. Many horticultural lighting brands provide maps generated under ideal conditions that don’t reflect your greenhouse geometry, mounting height, or spacing. Test in your actual installation.
7. Measuring once and never re-validating. LED output degrades over thousands of hours. Glazing gets dirty. Reflective surfaces dull. Continuous re-validation is now a recognized best practice, not a one-time commissioning step.
Connecting Measurement to Action
Measuring PPFD in a greenhouse is not an academic exercise. It directly drives three expensive decisions:
-
How many supplemental fixtures you need and where to place them. Your grid map and DLI deficit calculation determine fixture count, spacing, and mounting height.
-
How long to run supplemental lights each day. The DLI formula converts your measured PPFD deficit into a photoperiod. Longer hours at lower intensity and shorter hours at higher intensity can reach the same DLI, but energy costs and fixture specs differ. The guide on supplemental lighting hours covers this tradeoff in detail.
-
Whether your current setup is underperforming. If measured PPFD at canopy level has dropped below your crop’s target, the cause could be dirty glazing, degraded fixtures, or a design that was marginal from the start.
Many greenhouse LED upgrades also qualify for utility rebates, which can significantly reduce the capital cost of closing a light deficit.
Schedule a free consultation to discuss your greenhouse PPFD measurements and get recommendations tailored to your crop and facility.
Frequently Asked Questions
What is a good PPFD level for a greenhouse?
It depends on the crop. Leafy greens like lettuce do well at 200 to 400 µmol/m²/s, while fruiting crops like tomatoes need 400 to 800+. Cannabis in flower typically targets 600 to 1,000+ µmol/m²/s. The right PPFD level also depends on your DLI target, photoperiod, and CO2 strategy.
Can I use my phone to measure PPFD in a greenhouse?
Phone apps can give rough estimates under full-spectrum white light, particularly on iPhones. They become unreliable under narrow-spectrum LED fixtures with heavy red and blue output. For commercial decisions, a calibrated quantum PAR meter is the right tool.
How often should I measure PPFD in my greenhouse?
At minimum, measure at the start of each season and after any changes to fixtures, glazing, or layout. Best practice is continuous monitoring with data-logging sensors, since greenhouse light levels change constantly with weather, season, and glazing condition.
What is the difference between PPFD and DLI?
PPFD measures light intensity at a single moment (µmol/m²/s). DLI sums all the PPFD your crop receives over a full day (mol/m²/d). PPFD is the speedometer; DLI is the odometer. Crop outcomes are ultimately determined by DLI, but you need PPFD measurements to calculate it. For a full comparison, read the PPFD vs DLI guide.
How do I know if my greenhouse glazing is blocking too much light?
Take simultaneous PAR readings inside and outside the greenhouse and divide the indoor reading by the outdoor reading. If transmission has dropped below 50 to 55%, cleaning or replacing the glazing will likely deliver a better return than adding more supplemental fixtures.
Why don’t my PPFD readings match the manufacturer’s PPFD map?
Manufacturer maps are often generated in controlled settings with reflective walls and specific mounting heights. Your greenhouse has different dimensions, surfaces, and mounting conditions. Always verify claims with your own in-situ measurements using a calibrated meter.
What is an acceptable PPFD uniformity ratio for a commercial greenhouse?
An Emin/Eavg ratio between 0.75 and 0.90 is the industry target. A coefficient of variation below 15% is the accepted commercial threshold. Below these benchmarks, you will see noticeable differences in crop growth and quality across your growing area.
Do I need to measure PPFD below the canopy too?
For crops with dense upper canopies (cannabis, tomatoes, peppers), lower leaves often receive far less light than the top. Measuring below the canopy can reveal whether under-canopy lighting would improve overall crop quality and yield.