PPFD for Cannabis Flower Stage: 2026 Guide & Targets
PPFD for Cannabis Flower Stage: 600–1,000 µmol/m²/s; with CO₂, 900–1,500. Get DLI targets, week-by-week ramps, and uniformity tips. Learn more.
TL;DR
The standard PPFD for cannabis flower stage is 600 to 1,000 µmol/m²/s without CO₂ supplementation. With CO₂ at 1,200 to 1,500 ppm, growers can push to 1,000 to 1,500 µmol/m²/s. Peer-reviewed research shows that yield increases linearly with PPFD well beyond what most growers run, but the practical ceiling depends on CO₂ availability, environmental control, and energy economics. Canopy uniformity matters as much as peak intensity, and the 12-hour flowering photoperiod means every µmol counts.
What Is the Ideal PPFD for Cannabis Flowering?
PPFD (photosynthetic photon flux density) measures the amount of photosynthetically active light reaching the plant canopy each second. The appropriate PPFD for cannabis flowering depends on light intensity, CO₂ availability, cultivar, canopy structure, and environmental conditions.
For a quick reference, many indoor cannabis lighting guides use approximately 600–1,000 µmol/m²/s as a practical flowering range under ambient CO₂ conditions. Higher intensities may be usable in well-controlled environments with supplemental CO₂, but they are not automatically more productive or economical.
At a 12-hour flowering photoperiod, 600–1,000 µmol/m²/s corresponds to a daily light integral (DLI) of approximately 25.9–43.2 mol/m²/day. Measure PPFD across the canopy rather than relying on a single center reading, and interpret lighting targets alongside temperature, humidity, CO₂, and plant response.
Cannabis Flowering PPFD Targets at a Glance
Lighting condition | PPFD reference range | Important consideration |
|---|---|---|
Ambient CO₂, general reference | 600–1,000 µmol/m²/s | Actual response depends on cultivar and growing conditions |
Lower-intensity starting point | 600–700 µmol/m²/s | A reference range, not a universal requirement |
Higher-light environment with supplemental CO₂ | 1,000–1,500 µmol/m²/s | Requires suitable environmental control and economic justification |
Whole-canopy measurement | Map multiple points | Center readings alone can conceal uneven light distribution |
These values are reference ranges rather than guaranteed optimums. PPFD should be interpreted alongside photoperiod, DLI, CO₂ concentration, canopy temperature, humidity, and the plant's response to light. Research demonstrating yield gains at high PPFD does not establish that every cultivar or facility will benefit equally.
What PPFD Means and Why It Matters in Flower
PPFD stands for Photosynthetic Photon Flux Density. It measures the number of photosynthetically active photons (wavelengths between 400 and 700 nanometers) hitting a square meter of canopy every second, expressed in µmol/m²/s. Think of it as the intensity of usable light your plants actually receive at canopy level.
During the flowering stage, PPFD becomes the single most controllable lever for yield. The reason is simple: cannabis flowers under a 12/12 light cycle, which cuts the daily light window by a third compared to the 18-hour vegetative photoperiod. That compressed window means the plant has fewer hours to photosynthesize, so the intensity during those hours has to be higher to deliver enough total light energy.
This is where the relationship between PPFD and DLI (Daily Light Integral) becomes critical. DLI represents the total number of photons delivered across an entire day, measured in mol/m²/day. A PPFD of 1,000 µmol/m²/s running for 12 hours produces a DLI of 43.2 mol/m²/day. To hit that same DLI during an 18-hour vegetative photoperiod, you would only need about 667 PPFD. The flower room demands roughly 50% more intensity to compensate for the shorter light window. For a deeper explanation of this conversion, see this guide on DLI formulas and PPFD.
Here is a quick reference table for flowering cannabis under a 12-hour photoperiod:
PPFD (µmol/m²/s) | DLI (mol/m²/day) |
|---|---|
600 | 25.9 |
700 | 30.2 |
800 | 34.6 |
900 | 38.9 |
1,000 | 43.2 |
1,200 | 51.8 |
1,500 | 64.8 |
Formula: PPFD × 3,600 seconds × 12 hours ÷ 1,000,000
Most flower rooms perform best in the 40 to 50 mol/m²/day DLI range, which corresponds to 900 to 1,150 PPFD at 12 hours. With CO₂ supplementation and tight environmental control, the useful DLI ceiling shifts to 55 to 65+ mol/m²/day.
Explore commercial LED fixtures for flower rooms →
PPFD vs. DLI: What's the Difference?
PPFD measures the instantaneous intensity of photosynthetically active light reaching the canopy, while DLI measures the total amount of that light received over an entire day.
PPFD is expressed in µmol/m²/s. DLI is expressed in mol/m²/day and depends on both PPFD and the duration of the light period.
For a constant PPFD and a 12-hour photoperiod, the conversion is:
DLI = PPFD × 12 × 0.0036
For example, a PPFD of 800 µmol/m²/s maintained for 12 hours produces a DLI of 34.56 mol/m²/day. If PPFD remains constant, a longer photoperiod produces a higher DLI.
Both measurements are useful, but they answer different questions: PPFD describes light intensity at a particular moment, while DLI describes the accumulated daily light exposure. Neither measurement alone establishes whether a lighting setup is optimal for a particular crop.
PPFD Targets for Cannabis Flowering: The Numbers
Without CO₂ Supplementation
Under ambient CO₂ conditions (roughly 400 ppm), the practical PPFD range for cannabis flowering is 600 to 900 µmol/m²/s, with some growers pushing toward 1,000 as an upper bound.
Pushing past 1,000 µmol/m²/s without supplemental CO₂ delivers diminishing returns and raises the risk of light stress. At ambient CO₂ levels, the photosynthetic machinery runs out of carbon dioxide to fix before it runs out of light to absorb. More photons arrive than the plant can use productively, and the excess energy starts causing damage.
Practitioners on Reddit and cannabis forums consistently reinforce this ceiling. Multiple growers on the RollItUp forum report targeting 650 to 800 PPFD as a reliable range, with one experienced member noting they personally aim for 800 to 900 but ran into tip burn issues at readings over 1,000 without CO₂. A common refrain across grow forums: “Anything over 800 PPFD is a waste without CO₂.”
With CO₂ Supplementation
When CO₂ is supplemented to 1,200 to 1,500 ppm, the photosynthetic ceiling rises substantially. Growers can target 900 to 1,500 µmol/m²/s in the flower room.
The science behind this is straightforward. Research by Chandra et al. found that elevated CO₂ concentration (750 µmol/mol) stimulated net photosynthesis by 50% and water use efficiency by 111% compared to ambient CO₂. At high PPFD, carbon dioxide becomes the rate-limiting factor for photosynthesis. Supplementing it removes the bottleneck and lets the plant convert more light energy into growth.
One grower on RollItUp shared their experience running around 1,000 PPFD through most of flower with no issues, planning to push to 1,500 the next cycle: “Just have to dial everything else in. I run CO₂ btw.” That last part is key. High PPFD without CO₂ and proper environmental management doesn’t just fail to help; it actively hurts. For more on how CO₂ interacts with lighting strategy, read about CO₂ in controlled environment agriculture.
Running higher PPFD also means more heat load, more electricity, and a larger HVAC burden. The decision to push intensity is not purely biological. It’s an economic optimization: will the additional yield justify the additional energy, cooling, and CO₂ costs? That framing is explored further in this piece on reducing operating costs in cannabis facilities.
What Peer-Reviewed Research Actually Shows
Most grow guides cite the 600 to 1,000 PPFD range and move on. The actual research paints a more nuanced picture.
The University of Guelph Study (2021)
The most cited cannabis lighting study comes from Rodriguez-Morrison et al. (2021), published in Frontiers in Plant Science. Researchers grew cannabis plants for 12 weeks under a 12-hour flowering photoperiod at canopy-level PPFD ranging from 120 to 1,800 µmol/m²/s.
The headline finding: dry inflorescence yield increased linearly with increasing PPFD all the way up to 1,800 µmol/m²/s. There was no plateau in whole-plant yield within the tested range.
This is where the study gets interesting. Leaf-level photosynthesis saturated well below 1,800 µmol/m²/s, meaning individual leaves stopped increasing their photosynthetic rate at much lower light levels. But the whole-plant yield kept climbing. Why? Because cannabis plants are three-dimensional structures. Increasing canopy-level PPFD means more light penetrates to lower leaves, side branches, and interior bud sites that were previously light-starved. The “1,000 PPFD max” rule that circulates in grow forums comes from leaf-level photosynthetic curves, not whole-plant yield data. It’s a persistent myth worth correcting.
The study also found no significant effect of light intensity on cannabinoid potency within the tested conditions. However, this does not mean that light intensity has no effect on every aspect of flower quality. The researchers observed changes in inflorescence density and harvest index, as well as minor effects on terpene potency.
The key distinction is between yield and chemical concentration. Increasing PPFD can increase the amount of harvested flower without necessarily increasing the percentage concentration of THC or other cannabinoids. These outcomes should be evaluated separately rather than treating yield, potency, and overall quality as interchangeable metrics.
The results also need to be interpreted within the study's experimental conditions, including its cultivar, lighting setup, and flowering period. They demonstrate that cannabis can respond productively to high canopy-level PPFD, not that 1,800 µmol/m²/s is a universal optimum for commercial production.
The 2022 High-THC Cultivar Study
A 2022 study by Llewellyn et al. tested a high-THC cultivar (‘Meridian’) at 600, 800, and 1,000 PPFD. Inflorescence dry weight, the most economically relevant metric, was 1.6 times higher at 1,000 PPFD compared to 600. Again, no significant effect on cannabinoid concentrations.
This confirms the pattern: more light equals more flower weight without diluting potency.
The 2024 Czech Study
A 2024 study published in MDPI Agronomy compared 900 versus 1,300 PPFD during flowering. By the fifth week, plants under 1,300 PPFD developed noticeably larger and denser flowers. Interestingly, this study found that higher light intensities positively influenced CBD, THC, CBG, and CBC concentrations, with increases ranging from 17% to 43%. This somewhat contradicts the Guelph and Llewellyn findings on potency neutrality, likely reflecting cultivar-specific responses and different experimental conditions.
The Practical Takeaway
The biological ceiling for cannabis yield under PPFD is far above where most growers operate. The practical ceiling is set by economics and environmental control, not by the plant’s capacity to use light. Every additional 100 µmol/m²/s of PPFD carries additional costs in electricity, cooling, and CO₂. The right target for any given facility depends on what produces the best cost-per-gram, not simply the highest yield-per-square-meter.
What the Research Says About PPFD and Cannabis Yield
Study | Light levels or comparison | Main finding | Important limitation |
|---|---|---|---|
Rodriguez-Morrison et al. (2021) | 120–1,800 µmol/m²/s | Dry inflorescence yield increased with increasing canopy-level PPFD; cannabinoid potency did not show a significant treatment effect | Results apply to the tested cultivar and experimental conditions |
Llewellyn et al. (2022) | 600, 800, and 1,000 µmol/m²/s | Inflorescence dry weight at 1,000 PPFD was 1.6 times the value at 600 PPFD | One high-THC cultivar was tested |
Additional cultivar-specific research | Varies by experiment | Responses in cannabinoid concentration and flower quality may differ across experiments | Cultivar, environment, spectrum, and experimental design can affect results |
What this means for growers: Research supports a relationship between higher PPFD and greater cannabis flower yield under the conditions tested. It does not establish one ideal intensity for every cultivar or facility. Evaluate lighting decisions using yield, marketable flower quality, cannabinoid concentration, energy consumption, and total production cost.
Adjusting PPFD Through the Flowering Cycle
Experienced growers don’t set a single PPFD level and leave it for eight to ten weeks. They ramp intensity through the flowering cycle, matching light delivery to the plant’s changing capacity.
Early Flower (Weeks 1 to 2)
Start at 600 to 700 µmol/m²/s. The stretch period brings rapid growth, but the plant is transitioning from vegetative metabolism. Jumping straight to peak intensity risks light stress, especially if the veg room was running at 400 to 600 PPFD.
Plants raised at lower PPFD need 5 to 7 days to acclimate before you raise intensity. Skipping this step causes bleaching and photoinhibition, not faster growth.
Mid Flower (Weeks 3 to 6)
This is peak biomass accumulation. Ramp to 800 to 1,000 µmol/m²/s (or higher with CO₂). The plant’s photosynthetic capacity is at its highest, bud sites are filling in, and the canopy is dense enough to absorb high-intensity light efficiently.
An experienced grower on the RollItUp forum shared a detailed week-by-week protocol with CO₂: start at 800 PPFD in week 1 of flower, jump to 1,000 in week 2, crank to 1,500 during mid flower, then taper to 1,200 in the second-to-last week and 800 in the final week. Not every facility can or should run that aggressively, but the underlying principle of ramping up through mid flower and tapering late is widely practiced.
Late Flower (Weeks 7 to Harvest)
Many growers reduce PPFD to 700 to 800 µmol/m²/s during the final week or two. The biological rationale is debated, but practitioners report it helps with final ripening and reduces the risk of foxtailing or bleaching on mature buds. Some believe it mimics the natural decrease in light intensity that outdoor plants experience as autumn progresses.
For a complete guide to flower room lighting strategies beyond just PPFD targets, see our cannabis flower room lighting guide.
Why Canopy Uniformity Matters as Much as Peak PPFD
A single PAR meter reading at the center of the canopy tells you very little about what the whole grow is actually receiving. Most fixtures produce a bell-curve light pattern, with the highest intensity directly below center and significantly less at the edges. In indoor cannabis production, relatively small changes in distance from the light source can produce substantial differences in light intensity.
This matters for two reasons.
First, hot spots near fixture centers can push local PPFD well above safe thresholds, causing bleaching on the tallest colas while the edges of the canopy remain underlit. The result: a mix of bleached, degraded buds and larfy, underdeveloped lowers.
Second, average canopy PPFD is what drives average yield. A grow that reads 1,200 at center and 500 at the edges has an average around 850, but the distribution creates quality problems at both extremes. A properly designed layout that delivers a consistent 900 across the canopy will outperform it in both total yield and uniformity of flower quality.
Fixture selection and spacing determine uniformity. The goal is to overlap light patterns so that no point on the canopy sits more than 10 to 15% above or below the target PPFD. More detailed guidance on achieving this is available in our greenhouse lighting uniformity guide, which covers the metrics and methods that apply to any controlled environment.
See under-canopy LED lighting for lower-canopy PPFD →
How to Evaluate Canopy PPFD Uniformity
Do not evaluate a lighting layout using its highest PPFD reading alone. Measure multiple points across the canopy and compare the average, minimum, maximum, and spatial variation.
Measurement | What it tells you |
|---|---|
Average PPFD | The mean intensity across the measured canopy |
Minimum PPFD | The least-lit measured area |
Maximum PPFD | The brightest measured area |
PPFD variation | How consistently light is distributed across the canopy |
A canopy with large differences between its brightest and darkest areas may experience uneven growth and flower development. However, the best lighting layout depends on the canopy structure, fixture distribution, and environmental conditions.
Use a consistent measurement grid and record readings at canopy height. Repeat measurements when canopy height or fixture positioning changes. This provides a more reliable basis for evaluating lighting uniformity than a single center reading.
Under-Canopy Lighting: A Smarter Path to Higher Average PPFD
Rather than pushing top-light intensity ever higher (with diminishing returns and increasing heat load), adding light below the canopy offers a more efficient way to raise total crop output. A 2025 study on interlighting in cannabis found that supplemental under-canopy lighting achieved a 29.95% increase in dry flower yield, 24.4% higher THC accumulation, and 12.5% more total terpenes compared to top lighting alone.
The logic is simple. Dense cannabis canopies block a significant percentage of top light from reaching lower bud sites. Those lower sites produce airy, low-potency flowers that often get trimmed and processed rather than sold as premium product. Under-canopy fixtures bring light directly to those sites, converting waste biomass into marketable flower. Our detailed analysis in under-canopy lighting research covers the yield and quality data that support this approach.
What Happens When Flowering PPFD Is Too High
Excessive light intensity can contribute to photoinhibition, leaf damage, and bleaching of exposed flowers, but there is no single PPFD threshold that predicts light stress in every cannabis cultivar or growing environment.
Common Signs of Excessive Light or Heat Stress
Bleaching near the canopy top: Exposed leaves or flowers may develop unusually pale or white areas.
Upward leaf curling: Leaves may curl or change orientation in response to intense light, heat, or other environmental stressors.
Upper-leaf discoloration: Yellowing or bleaching may occur in exposed areas, although nutrient imbalances and other problems can produce similar symptoms.
Uneven flower development: Strong differences in light exposure across the canopy may contribute to inconsistent flower growth.
These symptoms are not diagnostic on their own. Before attributing damage to PPFD, evaluate leaf temperature, airflow, irrigation, nutrient conditions, and other environmental variables. Use canopy measurements and observed plant responses together to identify likely causes.
Increasing light intensity without accounting for the surrounding environment can add electricity and cooling costs without delivering a proportional production benefit.
Managing VPD in cannabis cultivation alongside PPFD is essential. Research has shown that cultivation under high relative humidity with reduced VPD (0.62 to 0.25 kPa) during flowering caused a 75.3% reduction in total biomass and a 71% reduction in flower biomass. Cranking PPFD without managing VPD and temperature produces worse results than moderate PPFD in a well-controlled room.
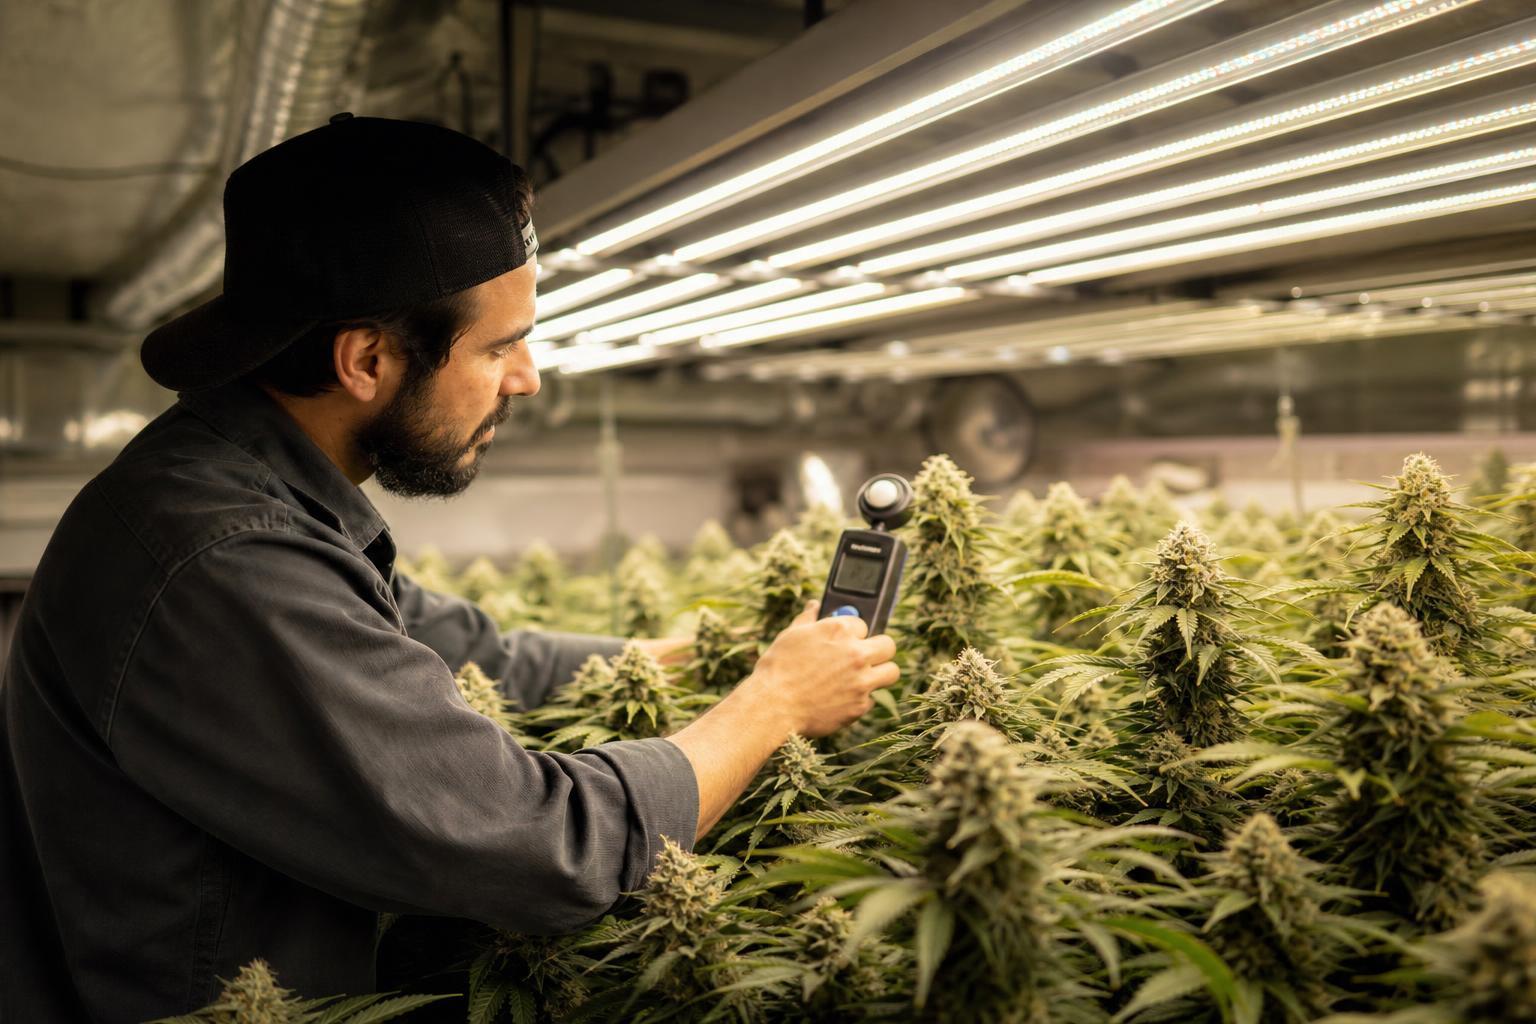
How to Measure PPFD in Your Flower Room
Getting your PPFD for cannabis flower stage right requires accurate measurement, not estimates.
Use a Quantum Sensor, Not a Lux Meter
A quantum sensor (commonly called a PAR meter) is the proper tool. It measures photon flux in the 400 to 700 nm photosynthetically active range. Apogee Instruments makes the professional standard. Budget alternatives exist, but accuracy varies.
Lux meters measure light as the human eye perceives it, weighting green wavelengths heavily and undervaluing the red and blue wavelengths that LEDs emphasize and plants use most. Camera-based phone apps have the same problem. They cannot accurately measure the PAR spectrum, particularly under LED grow lights. For accurate PPFD data to make grow room decisions, a proper quantum sensor calibrated for electric grow light spectra is necessary. More guidance on measurement tools and technique is available in our PAR meter guide.
Map the Canopy, Not Just One Spot
Take readings at canopy height across a grid of points, not just at the center under each fixture. A 3x3 or 4x4 grid per fixture footprint gives a meaningful picture of uniformity. Record the minimum, maximum, and average. The average tells you what your crop is actually getting. The spread between minimum and maximum tells you how much quality variation you should expect.
How to Calculate Average PPFD Across the Canopy
Take measurements at evenly distributed points across the canopy using a consistent grid. Record each reading at the same measurement height and use the same sensor orientation throughout the measurement process.
For a simple average, add all measured PPFD values and divide by the number of measurement points.
Average PPFD = Sum of measured PPFD readings ÷ Number of readings
For example, if nine equally weighted measurement points total 7,200 µmol/m²/s, their arithmetic mean is 800 µmol/m²/s.
An average does not reveal every unevenly lit area, so record the minimum and maximum readings as well. For more accurate lighting assessments, use a sensor appropriate for the fixture's spectrum and follow the manufacturer's calibration and measurement guidance.
Related Terms: PAR, PPF, PPFD, and DLI
These four terms are related but measure different things. Understanding how they connect prevents confusion.
PAR (Photosynthetically Active Radiation): The range of light wavelengths plants use for photosynthesis, 400 to 700 nm. PAR is the category, not a measurement.
PPF (Photosynthetic Photon Flux): The total number of PAR photons a light fixture emits per second, measured in µmol/s. This is a fixture-level output metric. It tells you nothing about what reaches the canopy. For a detailed comparison, see PPF vs. PPFD explained.
PPFD (Photosynthetic Photon Flux Density): The number of PAR photons hitting a specific point on the canopy per second per square meter, measured in µmol/m²/s. This is what the plant experiences. It depends on fixture output, mounting height, reflector design, and distance from the fixture center.
DLI (Daily Light Integral): The cumulative total of photons delivered over a full day, measured in mol/m²/day. DLI = PPFD × photoperiod hours × 0.0036. This is the metric that captures total light dose, accounting for both intensity and duration. For cannabis flowering at 12 hours, DLI and PPFD are tightly coupled.
For a broader look at light spectrum and plant growth beyond just intensity, that resource covers how different wavelengths influence morphology and chemistry.
Frequently Asked Questions
What is the ideal PPFD for cannabis flowering without CO₂?
A practical reference range is approximately 600–1,000 µmol/m²/s under ambient CO₂ conditions. The best intensity depends on cultivar, canopy structure, temperature, and other environmental factors. Higher PPFD does not guarantee a proportional increase in yield.
What PPFD should I target with supplemental CO₂?
Higher PPFD may be productive when CO₂ and other environmental conditions support the increased demand for photosynthesis. The article discusses 1,000–1,500 µmol/m²/s as a higher-light reference range, but these values are not universal optima. Consider measured crop response, environmental control, and production economics.
What is the difference between PPFD and DLI?
PPFD measures the instantaneous intensity of photosynthetically active light at the canopy, in µmol/m²/s. DLI measures the total amount of light received throughout the day, in mol/m²/day. DLI depends on both PPFD and photoperiod.
Does higher PPFD increase THC or cannabinoid potency?
Not necessarily. The 2021 Rodriguez-Morrison et al. study found that yield increased with PPFD without a significant effect on cannabinoid potency under the tested conditions. The 2022 ‘Meridian’ study also reported increased flower dry weight at higher PPFD. Responses may differ across cultivars and experimental conditions.
Can a phone app accurately measure PPFD?
A phone app should not be assumed to provide accurate PPFD measurements under grow lights. Camera sensors, spectral response, and calibration can affect readings. A suitable quantum sensor is preferable when making lighting decisions that require reliable PPFD data.
What are the signs of excessive light during flowering?
Possible signs include bleaching of exposed flowers or leaves, upward leaf curling, and discoloration near the canopy top. These symptoms can also result from heat or other environmental problems, so check PPFD readings and surrounding conditions before identifying the cause.
Getting PPFD right in the flower room is not just a biology question. It is a systems question that involves light intensity, CO₂ management, environmental control, and energy economics working together. The research is clear that cannabis can productively use more light than most growers provide, but only when the rest of the environment keeps pace.