PAR Meter for Greenhouse: 2026 Guide to PPFD & DLI
Learn how a PAR meter for greenhouse growers measures PPFD and DLI, maps uniformity, and sizes LEDs. Get tips and a 2026 buying guide.
TL;DR
A PAR meter measures the intensity of photosynthetically active radiation (400 to 700 nm) that drives plant growth, expressed as PPFD in µmol/m²/s. For greenhouse operators, it's an essential tool for quantifying how much sunlight actually passes through glazing, calculating the gap between available light and crop specific DLI targets, and sizing supplemental lighting to fill that deficit. Without one, you're guessing, and guessing gets expensive.
Greenhouse growing sits at the intersection of natural and artificial light. On a clear July afternoon, your crops might receive far more photons than they need. On a cloudy January morning in the northern latitudes, they might get less than half their minimum requirement. A PAR meter for greenhouse use is the instrument that turns this uncertainty into numbers you can act on.
Most online guides about PAR meters are written for indoor cannabis growers or vertical farm operators working in fully controlled environments. Greenhouse operators face a fundamentally different challenge: they need to measure sunlight transmission through their covering material, account for seasonal and hourly variability, and then determine exactly how much supplemental light to add. This guide covers all of it, including specific meter recommendations ranging from research grade instruments to affordable options that still deliver reliable data.
Talk to a lighting expert about your greenhouse's light levels and supplemental lighting needs.
Quick Answer: What Is the Best Way to Measure Greenhouse Light?
A PAR meter for greenhouse production measures PPFD, the amount of photosynthetically active light reaching your crops in µmol/m²/s. For best results, use a calibrated quantum sensor at canopy height and take readings across multiple points and times of day. For daily light management, combine PPFD measurements with DLI logging to determine whether natural sunlight meets your crop's target or supplemental lighting is needed.
What Is a PAR Meter?
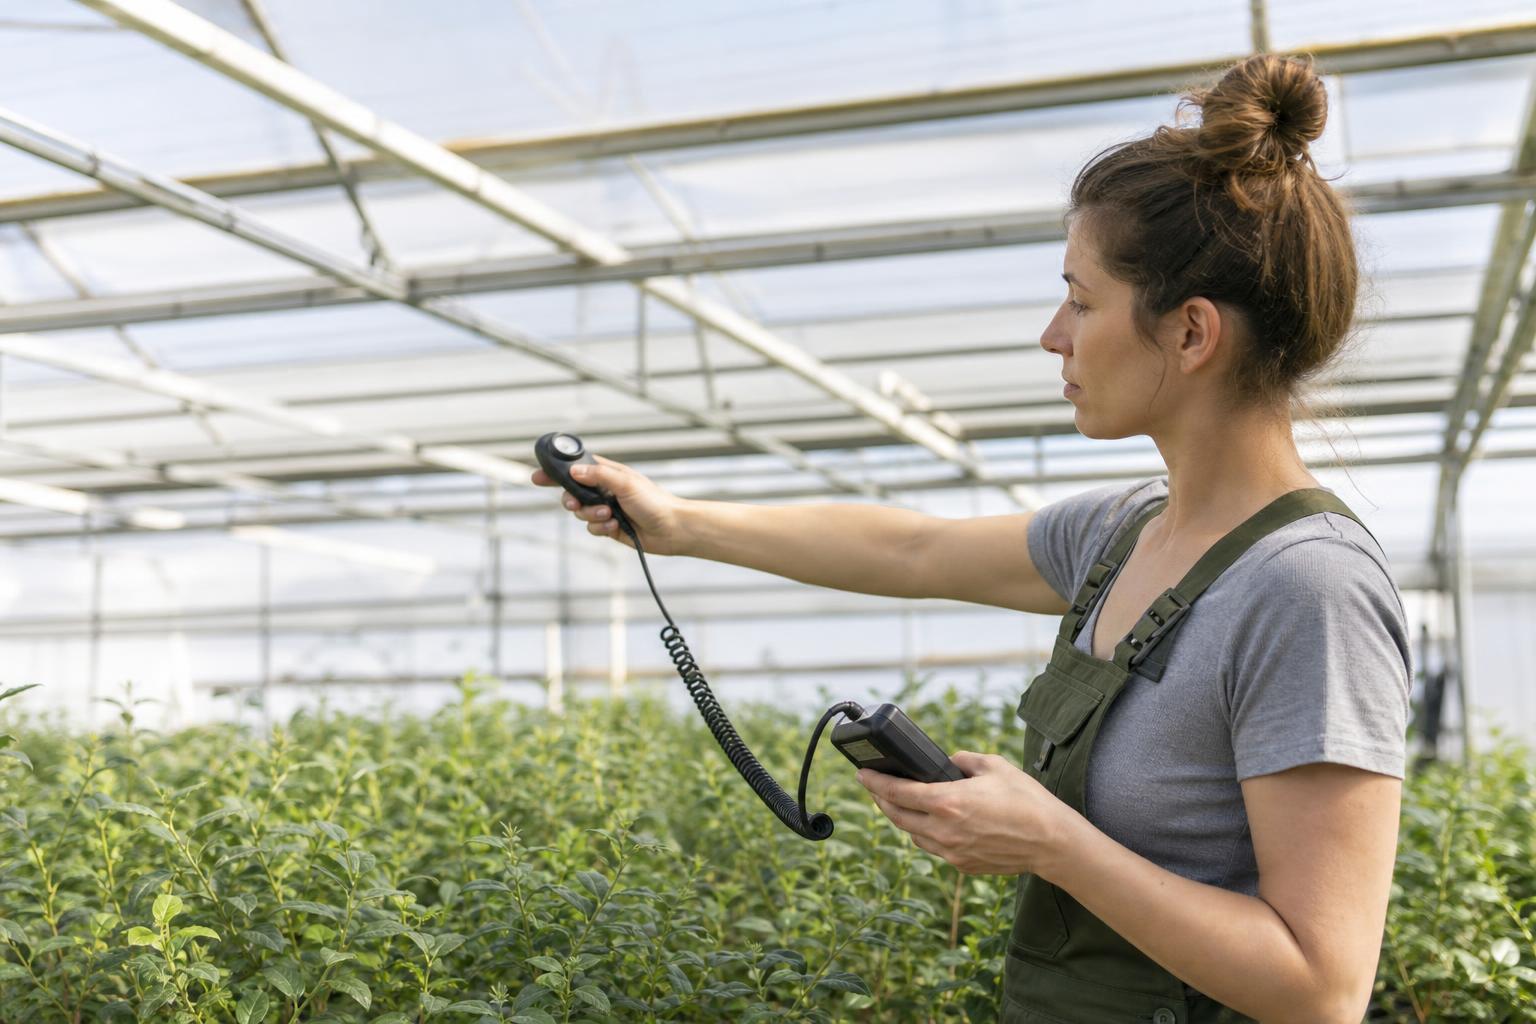
A PAR meter (also called a quantum meter or quantum sensor) is a device that measures the intensity of light in the photosynthetically active radiation range. PAR stands for Photosynthetically Active Radiation, which covers wavelengths between 400 nm and 700 nm, the portion of the light spectrum plants use for photosynthesis.
The instrument uses a calibrated photodiode paired with a physical optical filter to count photons in that range. The output is expressed as PPFD (Photosynthetic Photon Flux Density) in units of µmol/m²/s, meaning micromoles of photons hitting a square meter of surface every second. To take a reading, you place the sensor head at canopy height, point it toward the light source, and the meter displays an instantaneous PPFD value.
For a deeper look at how light spectrum affects plant growth across this wavelength range, spectrum selection matters just as much as intensity.
PAR Meter vs. Quantum Sensor
The terms PAR meter, quantum meter, and quantum sensor are often used interchangeably in greenhouse lighting discussions, but they can describe different parts of a measurement system.
A quantum sensor is the sensing device that measures photosynthetic photon flux. A PAR meter is typically the handheld display or instrument used to read the sensor's measurement. A fixed quantum sensor may instead connect to a data logger or environmental control system.
For practical greenhouse discussions, "PAR meter" is commonly used to describe the complete handheld measurement instrument.
PAR vs. PPFD vs. DLI: Clearing Up the Confusion
This is the single biggest source of confusion in grower education, and getting it straight is essential before you start measuring anything.
PAR is a qualitative category, not a number. It simply defines the range of wavelengths (400 to 700 nm) that plants use for photosynthesis. You can't "have 500 PAR." That phrase is technically meaningless, even though you'll hear it constantly in grower forums.
PPFD is the instantaneous intensity measurement. It describes how many photosynthetic photons land on one square meter in one second. When someone says their canopy is receiving "800 µmol," they're talking about PPFD. This is what a PAR meter actually reads.
DLI (Daily Light Integral) is the cumulative daily total. It adds up all the PPFD your plants received over an entire day, expressed in mol/m²/d (moles of photons per square meter per day).
Think of it like a rain gauge. A rain gauge doesn't tell you how hard it's raining at any given second. It tells you how much water accumulated over the whole day. DLI works the same way for light. A single PPFD reading tells you the intensity right now, but DLI tells you how much total light energy your plants actually received from sunrise to sunset or from lights on to lights off.
For greenhouse operators, DLI is arguably the more important metric because it captures the full picture across a variable day. Our detailed guide on PAR vs. PPFD breaks down the practical differences further.
Why Greenhouse Operators Specifically Need a PAR Meter
Indoor growers control 100% of their light. Their fixtures produce a predictable, measurable output, and that output doesn't change with the weather. Greenhouse operators live in a different world entirely.
Measuring Greenhouse Transmission
Every greenhouse covering, whether glass, polycarbonate, polyethylene film, or acrylic, blocks some percentage of incoming sunlight. New, high quality coverings transmit 80% or more of PAR light. Older or dirty coverings can drop well below 60%. Without measuring, you don't know where yours falls.
The method is straightforward. On a sunny day, use a PAR meter for greenhouse transmission testing by measuring sunlight intensity outside the greenhouse. Then move immediately inside and measure just above the crop canopy. The ratio of inside to outside readings gives you your transmission percentage. If the outdoor reading is 1,800 µmol/m²/s and the indoor reading is 1,260, your transmission is 70%.
But here's a complication that most guides skip: the angle of incidence matters enormously. Research from glazing manufacturers shows that when the sun is low in the sky (early morning, late afternoon, and throughout winter months at northern latitudes), flat greenhouse canopies reflect more light than they transmit. A single midday reading on a clear day will overstate your true average transmission. Logging readings throughout the day gives a much more accurate picture. Our guide on greenhouse shading and lighting covers the interplay between transmission and supplemental strategies.
Seasonal Variability

Natural light changes constantly. Clouds roll in, the sun's angle shifts through the season, and the photoperiod shrinks in winter. In northern North American greenhouses, winter DLI can drop below 10 mol/m²/d, which falls below the minimum requirement for most greenhouse crops. Summer DLI in the same location might exceed 40 mol/m²/d. That's a fourfold swing that demands measurement, not estimation.
Sizing Supplemental Lighting
This is where PAR meter data translates directly into capital decisions. The workflow greenhouse operators follow:
- Determine the outdoor DLI for your region and month (publicly available DLI maps provide this data)
- Measure your greenhouse transmission percentage with a PAR meter
- Calculate the DLI actually reaching your crop (outdoor DLI × transmission %)
- Compare that number to your crop's optimal DLI target
- Size supplemental lighting to fill the gap
For example, if your crop needs 17 mol/m²/d and your greenhouse delivers only 9 mol/m²/d in January, you need supplemental fixtures that provide the remaining 8 mol/m²/d. Our greenhouse lighting calculator walks through this math step by step.
Supplemental LEDs should be sized according to DLI deficit, not fixture wattage. This is a critical point. A fixture's watt rating tells you about electricity consumption, not about how many photons reach your plants. PPFD at canopy height, measured by a PAR meter for greenhouse applications, is what matters.
For greenhouses looking at supplemental top lighting solutions, the Altus 1K is purpose built for this application at 1,050W.
How to Use a PAR Meter in a Greenhouse: Step by Step
Greenhouse PAR Measurement Protocol
For a useful greenhouse light audit, consistency matters as much as the individual PPFD reading. A properly calibrated PAR meter for greenhouse work provides reliable data only when paired with a consistent measurement process.
Use the following protocol:
Sensor position: Place the sensor at crop canopy height.
Measurement pattern: Use a grid covering the production area rather than measuring only the center.
Number of points: Use at least 9 to 12 measurement points for a small or standard bay, adding more points as the growing area increases.
Timing: Record readings at multiple times of day because sunlight intensity and sun angle change continuously.
Weather: Record whether conditions are sunny, partly cloudy, or overcast.
Supplemental lighting: Measure natural sunlight separately from supplemental fixtures when evaluating fixture output.
Documentation: Record date, time, sensor location, PPFD, weather conditions, and lighting status.
Repeatability: Use the same sensor and measurement procedure when comparing seasonal or year over year results.
The goal is not to find one impressive PPFD number. The goal is to understand the range, average, and uniformity of light reaching the crop.
Step 1: Establish Your Baseline (Sunlight Only)
Farmer Tyler's guide offers a practical tip that experienced growers echo: take PPFD readings from multiple locations to create an average PPFD, and measure supplemental fixture output at night when there is no interference from sunlight. This separation of natural and artificial light gives you clean data for each source.
Take readings at canopy height across a grid pattern covering your growing area. Record at least 9 to 12 points for a standard greenhouse bay. Note the time, date, and sky conditions. Repeat at different times of day and across different seasons to build a realistic picture. For a detailed walkthrough of the measurement process, see this guide on how to measure PPFD in a greenhouse.
Step 2: Calculate Transmission
With your indoor and outdoor readings taken close together in time, divide indoor PPFD by outdoor PPFD. Do this across several days and conditions. Your average transmission percentage becomes a key planning input.
Step 3: Map Uniformity
Light distribution inside a greenhouse is rarely even. Structural elements cast shadows, end walls reflect or block light, and supplemental fixtures create hotspots. Practitioners on cannabis forums report using PAR meters to identify these variations and then adjusting fixture dimmers to balance the middle of the growing area with the edges. One grower shared on 420 Magazine that "using a PAR meter, the light intensity is higher in the middle, so I have to balance the middle with the rest of the grow area using the dimmers."
This uniformity mapping applies directly to greenhouse operations running supplemental lighting. A PAR meter for greenhouse uniformity checks reveals where your canopy is under lit and where it's over served.
Step 4: Calculate Your DLI and Identify the Deficit
The most accurate way to measure DLI is with a quantum sensor that logs readings over a full day and integrates them into a daily total. A quicker approach: find your outdoor DLI from interactive DLI maps, then multiply by your greenhouse's measured transmission percentage. Our guide on how to measure DLI in a greenhouse covers both methods in detail.
Step 5: Size Your Supplemental System
With your DLI deficit calculated, you can determine how many supplemental PPFD your fixtures need to deliver and for how many hours. This is where the data from your PAR meter for greenhouse use becomes a capital investment decision rather than just an interesting number.
How to Calculate DLI From PPFD

DLI is calculated by integrating PPFD over the amount of time the crop receives light. When the average PPFD remains reasonably consistent, you can use this shortcut:
DLI = Average PPFD × Hours of Light × 0.0036
For example, if a greenhouse receives an average of 300 µmol/m²/s for 12 hours:
300 × 12 × 0.0036 = 12.96 mol/m²/d
So the crop receives approximately 13.0 mol/m²/d.
The shortcut is useful for supplemental lighting because it lets growers translate a target PPFD into a daily photon contribution. However, natural greenhouse sunlight varies continuously, so a full day quantum sensor and data logger provide a more accurate DLI measurement than calculating DLI from a single spot reading. Our DLI formula guide provides detailed examples and shortcuts.
How to Use a PAR Meter to Check Greenhouse Light Uniformity
A PAR meter can reveal differences in light intensity between the center, edges, corners, and shaded areas of a greenhouse.
Take PPFD readings using a consistent grid at canopy height. Calculate the average and compare the highest and lowest readings. Large differences indicate that the crop may be receiving substantially different amounts of light depending on its position.
Common causes of uneven greenhouse PPFD include:
- Structural members and hanging equipment
- Greenhouse end walls
- Supplemental fixture spacing
- Fixture mounting height
- Glazing shadows
- Nearby buildings or trees
- Uneven crop canopy height
- Reflective or absorptive surfaces
Uniformity matters because a greenhouse can have an acceptable average PPFD while still containing areas that are significantly under lit or over lit.
Use PAR mapping to identify those areas before changing fixture quantity, mounting height, spacing, or dimming settings. For guidance on optimizing fixture placement, the grow light height guide covers the relationship between mounting height and uniformity.
DLI Calculation Examples
| Average PPFD | Photoperiod | Approx. DLI |
|---|---|---|
| 200 µmol/m²/s | 12 hours | 8.64 mol/m²/d |
| 300 µmol/m²/s | 12 hours | 12.96 mol/m²/d |
| 400 µmol/m²/s | 12 hours | 17.28 mol/m²/d |
| 500 µmol/m²/s | 12 hours | 21.60 mol/m²/d |
| 600 µmol/m²/s | 12 hours | 25.92 mol/m²/d |
| 800 µmol/m²/s | 12 hours | 34.56 mol/m²/d |
These values assume the listed PPFD is the average intensity throughout the entire photoperiod.
How to Calculate Greenhouse Light Transmission
Greenhouse light transmission estimates how much incoming sunlight reaches the crop after passing through the covering and greenhouse structure.
Use this basic calculation:
Light Transmission (%) = Indoor PPFD ÷ Outdoor PPFD × 100
For example:
- Outdoor PPFD: 1,800 µmol/m²/s
- Indoor PPFD: 1,260 µmol/m²/s
1,260 ÷ 1,800 × 100 = 70% transmission
For a useful comparison, take the indoor and outdoor readings as close together in time as possible and under similar sky conditions. Repeat the measurement at multiple times of day and at multiple locations rather than relying on a single reading.
Transmission can vary because of glazing material, age, dirt, condensation, structural shading, sun angle, and the condition of the covering.
Greenhouse Transmission Measurement Workflow
- Place the PAR sensor outdoors in an unobstructed location.
- Record the outdoor PPFD.
- Move the sensor inside and measure at approximately crop canopy height.
- Record the indoor PPFD.
- Calculate indoor PPFD ÷ outdoor PPFD × 100.
- Repeat the process at several locations and times.
- Use the resulting measurements to estimate realistic greenhouse light transmission.
For seasonal planning, combine measured transmission with monthly outdoor DLI data rather than assuming that a single clear day transmission measurement represents the entire year.
What to Look for in a Greenhouse PAR Meter
Not all PAR meters perform equally, and the greenhouse environment creates specific demands that indoor only growers don't face. Choosing the right PAR meter for greenhouse conditions means paying attention to a few key specifications.
Cosine Correction
A cosine corrected sensor provides accurate measurements of radiation striking a flat surface from all angles. In a greenhouse, light arrives from direct sun overhead, diffused light scattered by glazing, and reflected light off surfaces and structures. Without cosine correction, a sensor undercounts off angle photons, and in a greenhouse, a significant portion of your useful light arrives at oblique angles. When light strikes the sensor at an oblique angle, the response error can be substantial, especially during the early and late hours when sun angles are low.
This feature is non negotiable for greenhouse PAR measurement.
Calibration Stability
Budget PAR meters can start out reasonably accurate, then drift dramatically. Analysis comparing cheap meters against research grade instruments has found readings can shift by up to 50% after just one year due to degradation of low grade optics. For a hobby grower checking a tent, that drift is annoying. For a commercial greenhouse operator making lighting investment decisions based on PAR data, it's costly.
Research grade instruments like the Apogee MQ 500, which is the most commonly recommended meter across grower forums and Reddit discussions, hold calibration to within ±5% uncertainty with a drift rate of less than 2% per year.
Practitioners on Reddit's r/microgrowery and on the Overgrow forums consistently recommend the Apogee MQ 500 for professional greenhouse and commercial use. The consensus is clear: for operations where lighting decisions involve real capital, spend the money on a proper instrument.
Data Logging and DLI Integration
For greenhouse operators, DLI logging is more valuable than spot PPFD checks. Meters with a log mode record DLI in mol/m²/d over the full photoperiod. This lets you track actual accumulated light across seasons and adjust supplemental run times accordingly, rather than relying on a handful of point in time readings.
Measurement Range
Full sun at midday reaches approximately 2,000 to 2,200 µmol/m²/s. Your meter needs to handle this upper range without clipping. Most quality instruments max out around 4,000 µmol/m²/s, which provides adequate headroom.
PAR Meter for Greenhouse: Buying Checklist
When choosing a PAR meter for greenhouse use, prioritize measurement accuracy, cosine correction, calibration stability, measurement range, data logging, and compatibility with the light sources used in your greenhouse.
| Feature | Why It Matters | Priority |
|---|---|---|
| PPFD measurement | Provides plant relevant photon data | Essential |
| Cosine correction | Improves accuracy when light arrives from different angles | Essential |
| 0 to 2,000+ µmol/m²/s range | Prevents clipping under strong sunlight | Essential |
| Calibration stability | Keeps seasonal measurements comparable | Essential |
| DLI logging | Captures accumulated daily light | Highly useful |
| Data storage/export | Makes trend analysis easier | Useful |
| Wireless connectivity | Enables continuous monitoring | Useful for larger facilities |
| ePAR capability | Measures beyond traditional 400 to 700 nm PAR | Specialized |
| Waterproof/weather resistant sensor | Useful for outdoor transmission measurements | Useful |
| Calibration certificate | Provides documented measurement performance | Recommended for commercial operations |
For occasional greenhouse audits, a quality handheld quantum meter may be sufficient. Larger commercial facilities can benefit from fixed wireless quantum sensors that continuously monitor canopy level PPFD and DLI.
Recommended PAR Meters for Greenhouse Use
Choosing the right PAR meter for greenhouse operations depends on your operation size, budget, and how often you plan to measure. Here's a breakdown of three categories that cover most greenhouse operators.
Research Grade: Apogee MQ 500
The Apogee MQ 500 remains the standard recommendation for commercial greenhouse operations. It features a full spectrum quantum sensor with proper cosine correction, ±5% measurement uncertainty, and less than 2% annual drift. It also has a built in DLI logging function, which is critical for greenhouse seasonal tracking. At roughly $400 to $500, it's an investment that pays for itself the first time it prevents an undersized or oversized supplemental lighting purchase.
Practitioners on Reddit consistently point to the MQ 500 as the benchmark. One commercial grower on r/microgrowery summarized the consensus: once you're making lighting decisions that cost thousands, the meter price is trivial by comparison.
Mid Range: Photobio Quantum PAR Meter
The Photobio PAR meter, manufactured by LightMaster International under the Photobio brand, occupies an interesting middle ground. It uses a silicon photodiode sensor with cosine correction and is calibrated for both sunlight and LED sources, which matters for greenhouse operators measuring mixed light. The measurement range covers 0 to 4,000 µmol/m²/s, providing plenty of headroom for full sun conditions.
What sets the Photobio apart from budget meters is that it ships with a NIST traceable calibration certificate, giving commercial growers a documented accuracy baseline. Several growers on YouTube have noted its accuracy tracks closely with the Apogee MQ 500 under both sunlight and white LED spectra, while costing less. For greenhouse operators who need reliable data but don't need the Apogee's DLI logging function (or plan to calculate DLI manually), the Photobio is a solid choice.
Budget Friendly: SpotOn Quantum PAR Meter by Innoquest
For greenhouse operators watching their budget, particularly smaller operations or those doing infrequent audits, the SpotOn quantum PAR meter from Innoquest deserves a look. Priced around $100 to $130, it's the most affordable dedicated PAR meter that still uses a real quantum sensor rather than a converted lux sensor or smartphone camera.
The SpotOn measures 0 to 2,500 µmol/m²/s, which covers the full greenhouse range including direct sunlight. It includes cosine correction and is calibrated for sunlight, making it suitable for greenhouse transmission measurements. Practitioners on grower forums have reported that the SpotOn tracks within roughly 10% of more expensive instruments under sunlight, which is acceptable for most greenhouse planning work.
The trade offs are real, though. The SpotOn lacks DLI logging, has no data export capability, and its long term calibration stability isn't documented as precisely as the Apogee or Photobio. For a grower doing quarterly light audits rather than daily monitoring, those limitations are manageable. For operations that will base five or six figure lighting investments on their readings, spending more on a research grade meter is the smarter play.
Which One Should You Buy?
The decision comes down to what's at stake. If your greenhouse lighting system represents a significant capital investment (and it almost always does for commercial operations), the Apogee MQ 500 is worth every dollar. If you need a reliable backup meter or a solid primary instrument at a lower cost, the Photobio fills that role well. And if you're a smaller operation that simply needs to verify whether your greenhouse light levels justify adding supplemental fixtures, the SpotOn gets you real PAR data at a fraction of the cost.
What matters most is using any real quantum sensor rather than relying on lux meters, smartphone apps, or estimation. Any dedicated PAR meter for greenhouse light measurement beats guessing.
Types of PAR Measurement Instruments
PAR Measurement Instruments Compared
| Instrument | Best For | Accuracy | DLI Logging | Portability | Greenhouse Use |
|---|---|---|---|---|---|
| Handheld PAR meter | Periodic audits and troubleshooting | High with quality sensor | Some models | Excellent | Excellent |
| Fixed quantum sensor | Continuous monitoring | High | Yes | Low | Excellent |
| Line quantum sensor | Mapping variable light environments | High | Model dependent | Moderate | Excellent |
| Smartphone app | Quick estimates and hobby growing | Variable | Usually limited | Excellent | Basic |
| Lux meter | Human visible light measurements | Not suitable for direct PPFD measurement | No | Excellent | Limited |
For commercial greenhouse decisions, a calibrated quantum sensor is generally the most appropriate choice because it measures photon flux rather than human visual brightness.
Handheld PAR Meters
The most common form factor for greenhouse operators doing periodic light audits. Portable, battery powered, with a single sensor head on a cable or integrated into the body. You walk the greenhouse, take readings at canopy height, and record them manually or via the meter's memory. Good for quarterly or monthly checks and for initial system design.
Fixed Wireless Quantum Sensors
These are thumb sized sensors deployed permanently throughout a growing operation and connected to a central data collection system. They don't have screens; instead, they feed continuous PAR data to a logger or cloud platform. IoT connected versions enable real time monitoring from anywhere. For large greenhouses tracking seasonal changes and managing dynamic supplemental lighting schedules, fixed sensors provide the most complete data picture.
Line Quantum Meters
These instruments use multiple diode sensors arranged in a row, which averages out the effects of shadows and light hotspots. Line quantum meters can be the most accurate option for measuring light in greenhouses, where structural shadows create uneven distribution patterns that a single point sensor might miss or overweight.
Smartphone Apps
Smartphone apps use the camera's CMOS sensor with a software conversion model to approximate PPFD. They can get surprisingly close under broad spectrum white LEDs, but the accuracy gap widens under narrow band or unusual spectra. For hobbyists or quick field checks, apps like Photone offer a budget friendly option. For precision canopy tuning, commercial yield work, or fixtures with heavy red/blue output, a dedicated meter remains the safer bet.
Community opinion is split along predictable lines. Reddit discussions consistently show commercial growers treating dedicated meters as essential, while home scale growers find apps perfectly adequate for their needs.
Get a free consultation to discuss which measurement approach fits your greenhouse operation.
PAR Meter vs. Lux Meter: Why Lux Falls Short
A lux meter measures light intensity weighted for human vision. It gives the most weight to green wavelengths, peaking around 550 nm, because that's where the human eye is most sensitive. A practitioner on the RollItUp forum explained it clearly: "a lux meter weighs every photon arriving at its sensor, and gives the most weight to green with a peak at about 550nm, right? Because that's how our eyes work."
Plants don't see light the way we do. Under LED spectra that emphasize red or blue wavelengths, a lux meter can dramatically misrepresent the amount of photosynthetically useful light reaching the canopy. Two light sources might read identically on a lux meter but deliver very different amounts of PAR. Under certain spectra, lux meters can be off by 40% or more compared to a quantum sensor.
For any greenhouse making decisions about comparing LEDs to HPS or evaluating different fixture options, a quantum PAR meter is the only instrument that gives plant relevant data.
PAR vs. ePAR Meters
Standard PAR meters measure light from 400 to 700 nm. An ePAR (extended PAR) meter expands that range to 750 nm, capturing far red wavelengths that laboratory research has confirmed are photosynthetically active beyond the traditional cutoff.
For most greenhouse applications, standard PAR (400 to 700 nm) measurement is sufficient. The ePAR distinction becomes relevant only if you're running fixtures with significant far red output, which is relatively uncommon in standard greenhouse supplemental lighting. Unless your operation specifically uses far red strategies for morphology control or flowering responses, a standard PAR meter for greenhouse monitoring covers your needs.
PPFD and DLI Targets by Crop Type
PAR meter readings only become useful when they are compared with the light requirements of the crop and growth stage. The following ranges can be used as planning references, but actual targets vary with cultivar, production system, temperature, CO₂ availability, photoperiod, and growth stage.
| Crop or Stage | Approx. PPFD Planning Range | Approx. DLI Planning Range |
|---|---|---|
| Seedlings / propagation | 100 to 300 µmol/m²/s | 8 to 12 mol/m²/d |
| Leafy greens / herbs | 250 to 350 µmol/m²/s | 12 to 17 mol/m²/d |
| Tomatoes / peppers / cucurbits | 400 to 600 µmol/m²/s | 20 to 35 mol/m²/d |
| High light fruiting crops | 500 to 800+ µmol/m²/s | 25 to 40+ mol/m²/d |
These ranges should not be treated as fixed prescriptions. Use them as starting points, then adjust lighting based on crop performance, environmental conditions, cultivar, and the production objective. For crop specific guidance, see our detailed guides on tomato DLI targets, cucumber lighting requirements, and lettuce DLI planning.
The important measurement principle is simple: measure the actual light reaching the canopy, compare it with the crop's target DLI, and use the resulting deficit to determine whether supplemental lighting is justified.
PAR Meter Calibration and Maintenance
A PAR meter is only useful for decision making if its measurements remain consistent and traceable.
Follow the manufacturer's calibration recommendations and keep records of calibration dates. Commercial greenhouse operators should also establish a consistent process for checking the sensor before important lighting audits or investment decisions.
Keep the sensor head clean and protect it from damage, condensation, extreme conditions, and unnecessary exposure to contaminants.
For year over year comparisons, use the same calibrated instrument whenever possible. Changing sensors can introduce differences that look like changes in greenhouse light when the difference actually comes from the measurement equipment.
If measurements suddenly change without an obvious change in sunlight, greenhouse covering, crop canopy, or lighting, inspect the sensor and calibration status before changing the lighting system.
Common PAR Measurement Mistakes in Greenhouses
Confusing PAR with PPFD
PAR is the wavelength range. PPFD is the measurement. When someone says "my PAR reading was 600," they mean PPFD. The distinction matters when communicating with equipment suppliers, consultants, or researchers.
Using a Lux Meter as a Substitute
As discussed above, lux meters measure human visible light sensitivity, not plant usable photon flux. Under LEDs, the error can be dramatic. This is a particularly expensive mistake when it leads to under sizing or over sizing a supplemental lighting system.
Taking a Single Midday Reading
One reading at noon on a sunny day tells you almost nothing useful about your greenhouse's actual light environment. DLI logging or, at minimum, multiple readings across different times and conditions give a much more accurate picture. Greenhouse light varies by hour, season, and weather.
Ignoring Cosine Correction
Cheap sensors without cosine correction undercount light arriving at oblique angles. In a greenhouse where diffused and reflected light contributes substantially to total PAR, this error compounds.
Measuring with Supplemental Lights On During the Day
When you want to know what your supplemental fixtures deliver independently, measure at night with only the fixtures running. When you want to know total light reaching the crop, measure during the day with everything on. Mixing the two without clear intent produces confusing data.
Relying on a Drifted Meter
Multiple community discussions highlight a simple truth: consistency matters more than the absolute value. Always use the same meter for comparable results. For greenhouse operators tracking seasonal changes and making year over year comparisons, using the same calibrated instrument consistently matters more than buying the most expensive model available.
How PAR Meter Data Drives Supplemental Lighting Decisions
The connection between PAR measurement and supplemental lighting is direct and financial. Virginia Tech research outlines the key inputs for delivering supplemental lighting correctly: the average monthly DLI, the lighting system's PPFD at crop height, how much light is lost through the greenhouse covering and structure, and the desired DLI for the target crop. A PAR meter for greenhouse light audits provides exactly these inputs.
Greenhouse energy research has shown that DLI based lighting control, where supplemental fixtures respond dynamically to actual measured light levels, can save 75 to 190 MWh per hectare annually compared to fixed schedule operation. One study even found that up to 5.25 mol/m²/d of surplus light can be "carried over" from a sunny day to reduce supplemental lighting the following overcast day without harming lettuce growth.
None of this optimization is possible without accurate PAR measurement as the foundation. The PAR meter gives you the data. The data tells you what to buy, when to run it, and when to turn it off.
For operations ready to explore supplemental lighting options, our greenhouse supplemental lighting guide covers fixture selection, sizing, and ROI considerations. And if you're weighing the financial case, greenhouse lighting rebates can meaningfully improve payback periods.
Frequently Asked Questions
What does a PAR meter actually measure?
A PAR meter measures PPFD (Photosynthetic Photon Flux Density), which is the number of photons in the 400 to 700 nm wavelength range hitting one square meter per second. The unit is µmol/m²/s. Despite the name, the meter doesn't measure "PAR" as a thing but rather the intensity of light within the PAR range.
Can I use a smartphone app instead of a dedicated PAR meter?
For hobby scale growing or rough field estimates, apps like Photone provide useful approximations, especially under broad spectrum white light. For commercial greenhouse operations where lighting decisions involve capital investment, a dedicated quantum meter with proper cosine correction and stable calibration is the standard. The accuracy gap between apps and dedicated instruments widens significantly under narrow band LED spectra.
How often should I take PAR readings in my greenhouse?
At minimum, measure at the start of each season and after any changes to your greenhouse covering, structure, or lighting system. For operations using dynamic supplemental lighting control, continuous monitoring with fixed sensors provides the most actionable data. Even periodic monthly spot checks with a handheld PAR meter for greenhouse audits are far better than no measurement at all.
Why can't I just use a lux meter?
Lux meters weight light intensity for human visual sensitivity, peaking at green (550 nm). Plants use a broader range of wavelengths for photosynthesis, and the weighting is completely different. Under LED fixtures with high red or blue output, a lux meter can be off by 40% or more compared to a quantum PAR meter. For any plant growth application, lux readings are unreliable.
What's a good greenhouse light transmission percentage?
Ideal greenhouse covering transmits 80% or more of incoming PAR, with 90%+ preferred for high light crops. Real world transmission depends on glazing material, age, cleanliness, condensation, and structural shading. Measuring annually with a PAR meter for greenhouse transmission checks helps you catch degradation before it impacts crop performance.
How do I calculate DLI from my PPFD readings?
Multiply your average PPFD (in µmol/m²/s) by the number of seconds in your photoperiod, then divide by 1,000,000 to convert micromoles to moles. For a 12 hour photoperiod at an average 300 µmol/m²/s: 300 × 43,200 seconds ÷ 1,000,000 = 12.96 mol/m²/d.
Do I need an ePAR meter for my greenhouse?
Probably not. Standard PAR meters (400 to 700 nm) cover the needs of the vast majority of greenhouse operations. ePAR meters extend measurement to 750 nm and are only necessary if you're running fixtures with significant far red output as part of a specific morphology or flowering strategy.
Is the SpotOn PAR meter accurate enough for commercial use?
The SpotOn by Innoquest provides real quantum sensor measurements with cosine correction at a budget price point. Under sunlight, growers report it tracks within roughly 10% of research grade instruments, which is adequate for greenhouse transmission checks and basic light audits. For operations making large capital lighting decisions, the Apogee MQ 500 or Photobio meter provides tighter accuracy and better long term calibration stability.
How much does PAR meter accuracy matter for commercial decisions?
It matters a lot. Budget meters can drift up to 50% within a year, which means your supplemental lighting calculations could be based on readings that are half wrong. For a commercial greenhouse investing in a lighting system, that drift could mean over spending on fixtures you don't need or under lighting crops that then underperform. Research grade instruments with less than 2% annual drift pay for themselves quickly in decision accuracy.
Final Takeaway: Measure the Light Before You Design the Lighting
A PAR meter for greenhouse operations turns light from an estimate into measurable data.
Use it to determine how much sunlight reaches the canopy, quantify greenhouse transmission, map PPFD uniformity, calculate daily light exposure, and identify the DLI deficit that supplemental lighting needs to fill.
The key metrics work together:
PAR defines the relevant wavelength range.
PPFD tells you how much photosynthetic photon flux is reaching the crop right now.
DLI tells you how much light the crop receives over the course of the day.
For greenhouse lighting decisions, the goal is not simply to achieve a high PPFD number. The goal is to deliver an appropriate and reasonably uniform DLI for the crop while avoiding unnecessary energy consumption.
Once those measurements are available, fixture selection, mounting height, lighting schedules, and supplemental lighting capacity can be designed around actual greenhouse conditions rather than assumptions.
If you want help interpreting greenhouse PAR/PPFD measurements or sizing supplemental lighting from a DLI deficit, talk to a greenhouse lighting specialist.
Schedule a free consultation to discuss how PAR data from your greenhouse can inform the right supplemental lighting design for your crops.