How to Measure DLI in Greenhouse: 2026 Methods & Tips
Learn how to measure DLI in greenhouse using quantum sensors, manual PPFD + formula, and DLI maps. Get setup tips, targets, and when to add lighting.
TL;DR
Daily light integral (DLI) measures the total photosynthetically active light delivered to your crops over a 24-hour period, expressed in mol·m⁻²·d⁻¹. You can measure DLI in a greenhouse using three methods: a quantum sensor with a data logger (most accurate), manual PPFD readings with a conversion formula, or outdoor DLI maps adjusted by your greenhouse’s light transmission factor. Greenhouse glazing and structural elements typically cut outdoor light by 35 to 50%, so measuring inside at plant height is critical. Once you know your DLI, compare it against crop-specific targets to decide whether supplemental lighting is worth the investment.
DLI is the single number that tells you whether your greenhouse crops are getting enough light. Not the light at noon on a clear day. Not the reading from a sensor bolted to your roof. The total photosynthetically active radiation your plants actually receive across a full day, measured right where they grow.
Most growers understand that light matters. Fewer know exactly how much their crops are getting, especially during the winter months when supplemental lighting decisions can make or break profitability. This guide covers the practical details of how to measure DLI in a greenhouse: the tools, the math, the sensor placement rules, the common mistakes, and what to do once you have a number.
If you’re evaluating whether supplemental lighting makes sense for your operation, explore greenhouse top-light options designed to close DLI gaps efficiently.
What Is DLI?
Daily light integral describes the total number of photosynthetically active photons (light in the 400 to 700 nm wavelength range) delivered to one square meter over a 24-hour period. The unit is mol·m⁻²·d⁻¹, meaning moles of photons per square meter per day.
The best analogy comes from university extension programs: DLI works like a rain gauge. A rain gauge doesn’t tell you how hard it rained at 2 PM. It tells you how much total rain fell in that spot over the entire day. DLI does the same thing for light.
PPFD vs. DLI
PPFD (photosynthetic photon flux density, measured in µmol·m⁻²·s⁻¹) is a snapshot. It tells you the light intensity at one moment. DLI is the movie, the cumulative total of all those snapshots across 24 hours. Throughout the course of a day in a greenhouse, PPFD changes constantly with cloud cover, sun angle, and time of day. A single PPFD reading at noon tells you almost nothing about what your plants actually received over the full photoperiod.
For a deeper comparison of these two metrics and how they relate, see this guide to PPFD vs. DLI.
Why DLI Matters
DLI directly influences flowering time, yield, plant quality, and crop uniformity. It also drives one of the most expensive decisions a greenhouse operator makes: whether to invest in supplemental lighting, how much, and when to run it. Supplemental lighting commonly accounts for 10 to 30% of operating expenses, so getting the measurement right has real financial consequences.
Three Methods to Measure DLI in Your Greenhouse
Multiple authoritative sources, including Purdue, MSU, and Virginia Tech extension programs, converge on three methods to calculate greenhouse DLI: quantum sensors with data loggers, manual PPFD readings with a conversion formula, and DLI maps adjusted by a transmission factor. Each method has tradeoffs in accuracy, cost, and complexity.
Method 1: Quantum Sensor + Data Logger (Most Accurate)
This is the gold standard. A quantum sensor measures photosynthetically active radiation in the 400 to 700 nm range, and a connected data logger records those readings at regular intervals, typically every 10 to 15 minutes, over a full 24-hour cycle. The data logger (or connected software) then integrates those readings into a DLI value automatically.
Equipment tiers:
- Professional-grade: Apogee Instruments (SQ-500 series sensors, MQ-500 handheld meter) and LI-COR (LI-190R sensor with LI-1500 data logger). High-quality quantum sensors from these manufacturers accurately measure both sunlight and electric lighting for plant applications. Most list calibration accuracy at ±5%.
- Mid-range: Spectrum Technologies WatchDog data loggers with integrated quantum sensors. These work well for operations that need multiple sensor locations without the cost of LI-COR hardware.
- Budget/hobby: Various imported PAR meters exist at lower price points, but cheaper sensors can have large directional errors and may not tolerate the heat and humidity inside a greenhouse over time. As sensors age, accuracy degrades faster with lower-quality hardware.
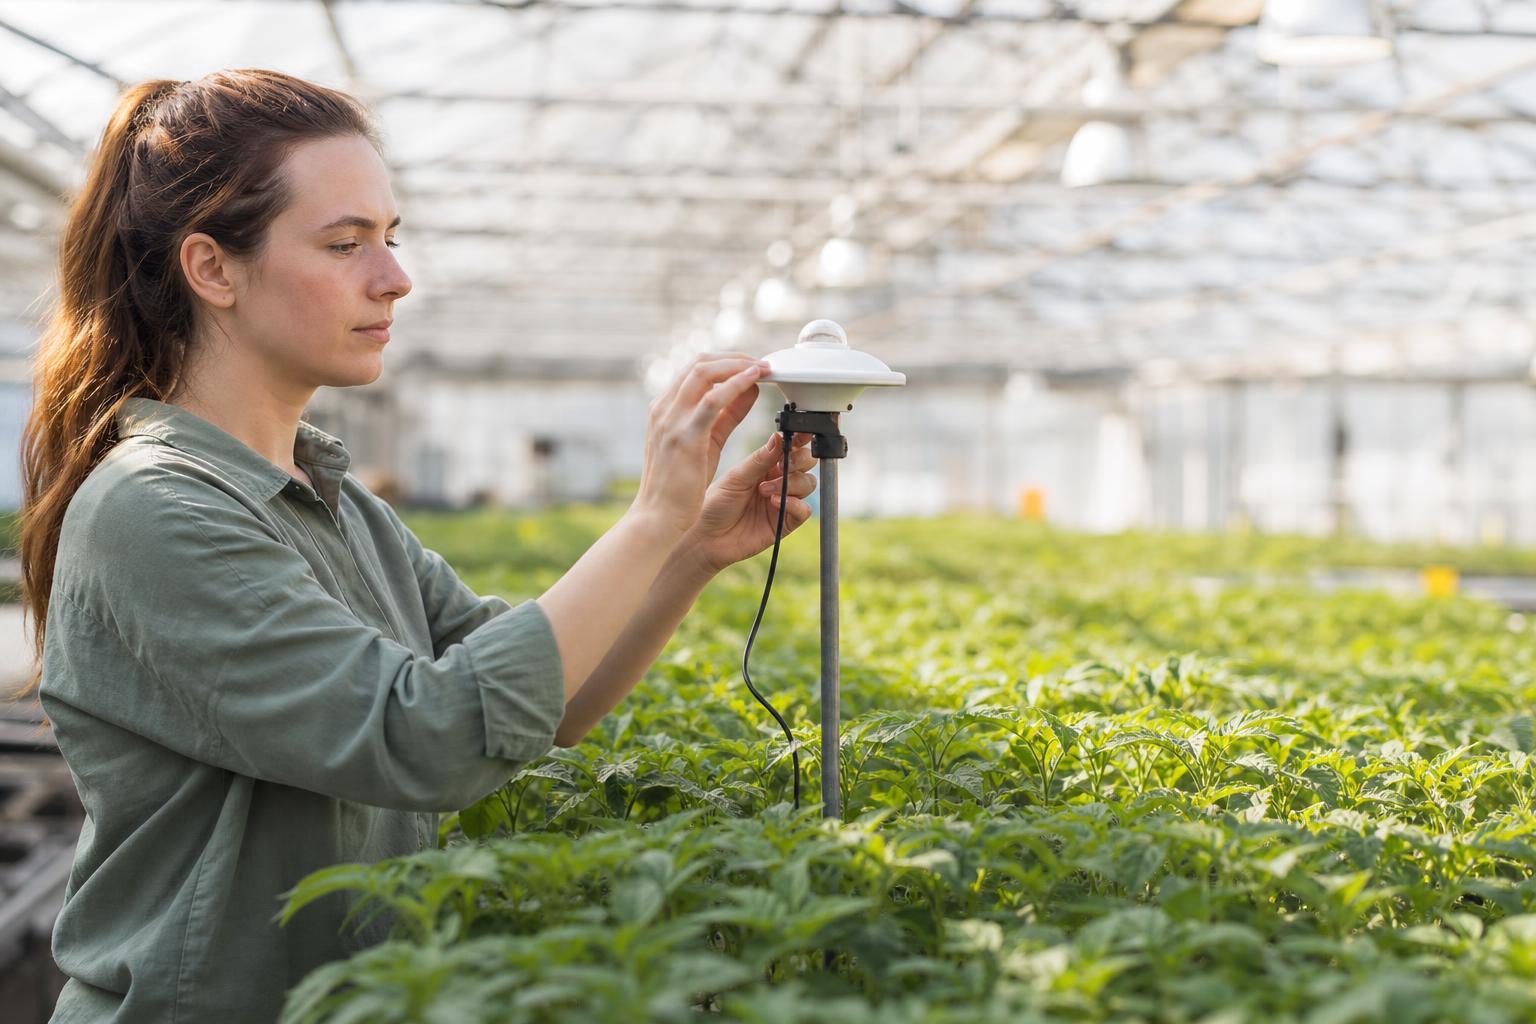
Setup: Place the sensor inside the greenhouse at plant canopy height, connect it to a data logger or environmental control system, and let it run for a minimum of 24 hours. For useful seasonal data, log continuously for weeks or months.
Method 2: Manual PPFD Readings + Conversion Formula
If you own a handheld quantum meter but not a data logger, you can still calculate DLI by taking periodic PPFD readings throughout the day and averaging them. This method is less accurate because it misses the constant fluctuation between readings, but it gives a workable estimate.
The formula:
DLI = Average PPFD × 0.0864
This constant (0.0864) comes from multiplying 3,600 seconds per hour by 24 hours, then dividing by 1,000,000 (the number of µmol in one mol). It assumes you are averaging across a full 24-hour period, including nighttime zeros.
For a specific photoperiod rather than a full day:
DLI = PPFD × Photoperiod (hours) × 3,600 ÷ 1,000,000
Worked example: You take PPFD readings every hour from midnight to midnight inside your greenhouse. The calculated average of all 24 readings is 201 µmol·m⁻²·s⁻¹. Multiply by 0.0864, and the result is 17.4 mol·m⁻²·d⁻¹. That’s your DLI for that day.
For a full walkthrough of DLI calculations with additional examples, read our greenhouse DLI calculator and formula guide.
Practical tip: Take at least 10 to 12 readings spread across daylight hours, including early morning and late afternoon when intensity is lowest. The more readings, the closer your average will reflect reality.
Method 3: DLI Maps + Greenhouse Transmission Factor (Estimation)
Jim Faust of Clemson University and Joanne Logan of the University of Tennessee developed high-resolution DLI maps for the United States based on solar radiation data from 1998 to 2012. Each data point represents just 10 square kilometers, and the maps are available online for every month of the year.
How to use them:
- Look up your location on the map and note the outdoor DLI for the month you care about.
- Determine your greenhouse’s light transmission percentage. Go outside and take a PAR reading, then take readings at several locations inside the greenhouse and average them. Divide the indoor average by the outdoor reading.
- Multiply the map DLI by your transmission percentage.
Example: The map shows your location receives 30 mol·m⁻²·d⁻¹ outdoors in June. You measure 6,300 µmol·m⁻²·s⁻¹ outside and an average of 4,100 µmol·m⁻²·s⁻¹ inside. Your transmission is about 65%. So your estimated interior DLI is 30 × 0.65 = 19.5 mol·m⁻²·d⁻¹.
This method is useful for planning, seasonal forecasting, and supplemental lighting budgets. But it’s an estimate, not a measurement. It won’t capture the specific obstructions, dirty glazing, or hanging baskets in your particular greenhouse.
Sensor Placement Best Practices
Where you put the sensor matters as much as which sensor you buy. This is the area where practitioners on forums and in extension workshops report the most costly mistakes.
Always measure inside the greenhouse, not outside. Many environmental control systems have light sensors, but they are often located outside the greenhouse on a weather station. A sensor on the roof cannot account for glazing losses, structural shading, shade curtains, or hanging baskets. Erik Runkle at MSU and other extension researchers consistently emphasize that a DLI sensor must be positioned inside the greenhouse at or near crop height.
Place the sensor at plant canopy height. Light at the ridge is not light at the crop. You need the reading from where your plants actually grow.
Keep it level. A tilted sensor will over-read or under-read depending on the angle relative to the sun. Even a few degrees of tilt introduces meaningful error.
Avoid walls, posts, and overhead obstructions. The sensor should be positioned away from side walls, main aisleways, and anything that casts a shadow during part of the day.
Take multiple readings for spatial variability. Light is not uniform across a greenhouse bay. Practitioners on Reddit and in extension workshops report that measuring at 5 to 10 representative positions and averaging is the only way to get a meaningful number. For example, if measured indoor PPFD values are 792, 876, 853, 775, and 834 µmol·m⁻²·s⁻¹, the useful average is 826.
Keep sensors clean. Water spots, mineral buildup, and greenhouse spray residue degrade accuracy. Wash sensors periodically with deionized water.
The PPFD-to-DLI Conversion Formula
This formula comes up so often that it’s worth isolating for quick reference.
For a 24-hour average PPFD:
DLI (mol·m⁻²·d⁻¹) = Average PPFD (µmol·m⁻²·s⁻¹) × 0.0864
For a specific photoperiod:
DLI = PPFD × Hours × 3,600 ÷ 1,000,000
Quick reference table:
| Average PPFD (µmol·m⁻²·s⁻¹) | Photoperiod (hours) | DLI (mol·m⁻²·d⁻¹) |
|---|---|---|
| 100 | 10 | 3.6 |
| 100 | 16 | 5.8 |
| 200 | 10 | 7.2 |
| 200 | 16 | 11.5 |
| 300 | 12 | 13.0 |
| 400 | 12 | 17.3 |
| 500 | 14 | 25.2 |
| 700 | 12 | 30.2 |
| 900 | 12 | 38.9 |
This table is especially useful when planning supplemental lighting hours. For more on running these calculations for your specific facility, see this greenhouse supplemental lighting hours guide.
Why Greenhouse DLI Is Lower Than You Think
This is where many growers get a rude awakening when they measure DLI for the first time in their greenhouse. As one extension professor put it, “the human eye is a lousy light sensor” because our eyes constantly adjust to ambient conditions, masking how much light we’ve actually lost.
Greenhouse glazing alone reduces light transmission by 35 to 50% compared to outdoors, even without shade curtains or whitewash. Add structural elements, heat pipes, trusses, and hanging baskets, and canopy-level PAR can drop to just 40 to 60% of outdoor levels.
The numbers get alarming in winter. In the northern United States and Canada, it is not uncommon for the average DLI inside a greenhouse to fall below 3 mol·m⁻²·d⁻¹ during the darkest months. Outdoor DLI across the United States ranges from about 5 to 60 mol·m⁻²·d⁻¹ depending on latitude, season, and cloud cover, but once you apply a greenhouse transmission factor, the indoor number can be strikingly low.
For context, most bedding plants and potted crops need at least 10 to 12 mol·m⁻²·d⁻¹. A greenhouse in Michigan or Ontario delivering 3 mol·m⁻²·d⁻¹ in January is operating at less than a third of the minimum target for those crops.
Understanding these losses is the first step toward reducing operating expenses through smarter lighting and glazing maintenance.
DLI Targets by Crop Type
Once you know how to measure DLI in a greenhouse, the next question is: what number are you shooting for? These targets come from university research and represent the ranges where each crop type performs well in terms of growth rate, quality, and yield.
| Crop Category | DLI Target (mol·m⁻²·d⁻¹) |
|---|---|
| Propagation / cuttings | 4 – 6 |
| Low-light ornamentals | 3 – 6 |
| Bedding plants, herbs, potted crops | 10 – 12 |
| Medium-light crops | 6 – 12 |
| High-light crops | 12 – 18 |
| Leafy greens / lettuce | 12 – 17 |
| Cucumbers | 20 – 35 |
| Tomatoes | 20 – 50 |
| Sweet bell peppers | 25 – 50 |
| Cannabis seedlings / clones | 15 – 20 |
| Cannabis vegetative | 25 – 40 |
| Cannabis flowering | 35 – 50 |
A few notes on these numbers. Cannabis flower rooms are a special case because the 12-hour photoperiod constraint during flowering means you need high PPFD (700 to 900+ µmol·m⁻²·s⁻¹) to reach the 35 to 50 mol·m⁻²·d⁻¹ target. With CO₂ enrichment, commercial operations push PPFD to 900 to 1,500 µmol·m⁻²·s⁻¹. For detailed stage-by-stage cannabis targets, see this cannabis DLI guide.
Fruiting vegetables like tomatoes and peppers can use remarkably high DLI levels, which is why greenhouse vegetable operations in high-latitude regions are among the heaviest users of supplemental lighting.
The maximum DLI achievable in a greenhouse from sunlight alone tops out at roughly 25 to 30 mol·m⁻²·d⁻¹ on a clear late-spring day. Anything above that requires supplemental light.
What to Do After You Measure
Measuring DLI is not the end goal. It’s the starting point for three decisions.
1. Is your DLI meeting crop targets?
Compare your measured DLI against the targets above. If you’re hitting 15 mol·m⁻²·d⁻¹ and growing lettuce, you’re in good shape. If you’re at 5 mol·m⁻²·d⁻¹ and growing tomatoes, you have a significant deficit.
2. Do you need supplemental lighting, and when?
In the northern half of the United States, greenhouse DLI falls below the 10 to 12 mol·m⁻²·d⁻¹ target for bedding plants for roughly three months each year. That’s the window where supplemental lighting provides the most value. Outside that window, sunlight may be sufficient, and running fixtures wastes energy. DLI measurement tells you exactly when to turn lights on and off across the season.
Research from the University of Georgia found that DLI-based adaptive LED lighting controls can cut electricity costs by 20 to 92% compared to running lights on a fixed schedule. The savings come from dimming or shutting off supplemental lights on days when sunlight provides adequate DLI on its own.
For greenhouse operations evaluating supplemental lighting to close a DLI gap, the Pinnacle series covers multiple power classes suited to different greenhouse scales and crop targets.
3. Can you recover light without adding fixtures?
Before investing in supplemental lighting, check whether you can improve DLI by cleaning glazing, removing unnecessary shade curtains, or reorganizing hanging baskets that block light. These changes cost little and can recover several mol·m⁻²·d⁻¹. If the gap is still too large after maintenance, supplemental lighting becomes the practical answer.
For help understanding greenhouse lighting rebates that offset the cost of supplemental lighting, check available utility incentive programs in your region.
Common Mistakes When Measuring DLI
These errors are widespread enough that university extension programs dedicate entire sections to them. Avoid these and your data will be dramatically more useful.
Using a lux or footcandle meter instead of a quantum sensor. Footcandle meters measure photometric light (what the human eye sees), not photosynthetically active radiation. The conversion factors from footcandles to PAR vary by light source: sunlight, HPS, and LEDs each require different multipliers. If you apply the wrong factor, or try to compare LEDs to HPS using footcandle data, your DLI estimate will be meaningless.
Placing the sensor outside the greenhouse. This is the most common and most consequential mistake. An outdoor sensor on a climate computer cannot account for glazing transmission, shade curtains, structural shading, or hanging baskets. Your plants don’t grow outside. Measure where they grow.
Taking a single reading instead of logging over 24 hours. One PPFD snapshot at solar noon tells you the peak, not the integral. DLI requires data across the entire day, including the low-intensity morning and evening hours that still contribute photons.
Not accounting for greenhouse transmission. If you’re using DLI maps, you must multiply by your actual measured transmission percentage. Assuming 100% transmission, or even a generic 60%, can produce errors of several mol·m⁻²·d⁻¹.
Measuring only on clear days. DLI measurement is most valuable as a long-term average, especially during winter months when supplemental lighting decisions matter most. A single bright day in January is not representative of your January DLI.
Ignoring spatial variability. Light is not uniform across a greenhouse bay. One spot near the south wall might receive twice the light as a spot in the center under a truss. Measuring at a single point and assuming it represents the whole house is a recipe for uneven crop quality.
Frequently Asked Questions
What equipment do I need to measure DLI in a greenhouse?
At minimum, you need a quantum sensor that measures PAR in the 400 to 700 nm range, plus a data logger to record readings over 24 hours. Professional options include Apogee Instruments sensors (SQ-500 series) and LI-COR sensors (LI-190R) paired with their respective data loggers. For a rougher estimate, a handheld quantum meter like the Apogee MQ-500 works if you take readings throughout the day and use the conversion formula manually.
How do I convert PPFD to DLI?
Multiply the average PPFD over 24 hours by 0.0864. If you know the specific photoperiod, use: DLI = PPFD × Hours × 3,600 ÷ 1,000,000. For example, an average of 200 µmol·m⁻²·s⁻¹ over a 12-hour photoperiod yields a DLI of 8.6 mol·m⁻²·d⁻¹.
Where should I place the light sensor in my greenhouse?
Inside the greenhouse at plant canopy height, level, away from walls and overhead obstructions, and not shaded by posts or hanging baskets. Never rely on a sensor mounted on the roof or outside the greenhouse. Take readings at multiple positions to capture the spatial variability that exists in every greenhouse bay.
Can I use a lux meter to measure DLI?
A lux or footcandle meter is not ideal because it measures light as the human eye perceives it, not as plants use it. Conversion factors from footcandles to PAR differ for sunlight, HPS, and LED sources. If a quantum sensor is not available, you can convert footcandle readings to approximate PAR values, but the result will be less accurate than a direct quantum sensor measurement.
What is a good DLI for greenhouse crops?
It depends on the crop. Propagation cuttings need 4 to 6 mol·m⁻²·d⁻¹. Most bedding plants, herbs, and potted crops need 10 to 12. Fruiting vegetables like tomatoes and peppers perform best at 20 to 50. Cannabis in flower typically targets 35 to 50 mol·m⁻²·d⁻¹. These ranges are guides, not absolutes, and vary by cultivar, temperature, and CO₂ levels.
Why is my greenhouse DLI so much lower than outdoor DLI?
Greenhouse glazing alone typically reduces light by 35 to 50%. Structural elements, hanging baskets, retractable shade curtains, and dirty glazing panels reduce it further. It is common for canopy-level PAR inside a greenhouse to be only 40 to 60% of the outdoor value. In winter at northern latitudes, this can push interior DLI below 3 mol·m⁻²·d⁻¹.
How often should I measure DLI in my greenhouse?
Continuous logging with a quantum sensor and data logger is best, giving you daily and seasonal trends. At minimum, measure during key decision windows: late fall (to determine when supplemental lighting should begin), midwinter (to quantify the DLI deficit), and early spring (to determine when supplemental lighting can stop). These seasonal measurements directly inform your lighting schedule and energy budget.
When does supplemental lighting make economic sense based on DLI?
When your measured DLI consistently falls below your crop’s target, supplemental lighting closes the gap. In the northern United States, this typically occurs for about three months of the year for ornamental greenhouse crops. DLI-based adaptive controls that adjust supplemental light output based on incoming sunlight can reduce lighting energy costs by 20 to 92% compared to fixed schedules, making the investment significantly more attractive.
Knowing how to measure DLI in a greenhouse transforms lighting from guesswork into a data-driven decision. The tools are accessible, the math is straightforward, and the payoff in crop quality and energy savings is substantial.
If your measurements reveal a DLI gap, the next step is designing a supplemental lighting system matched to your specific crops, geography, and budget. Contact the Thrive Agritech team for a consultation on closing that gap with the right fixtures and layout for your facility.