Greenhouse Light Meter 2026: PPFD, DLI & PAR Guide
Learn how to use a greenhouse light meter to measure PAR/PPFD, convert to DLI, and size LED lighting. Avoid lux errors and boost yields. Start now.
TL;DR
A greenhouse light meter is an instrument that measures the photosynthetically active radiation (PAR) reaching your plants, reported in PPFD (µmol/m²/s). Unlike standard lux meters, which are calibrated for human vision, a proper greenhouse light meter reads the 400 to 700 nm wavelengths that actually drive photosynthesis. Getting this measurement right is the foundation for every supplemental lighting decision, from calculating your Daily Light Integral (DLI) deficit to sizing LED fixtures that close the gap.
What Is a Greenhouse Light Meter?
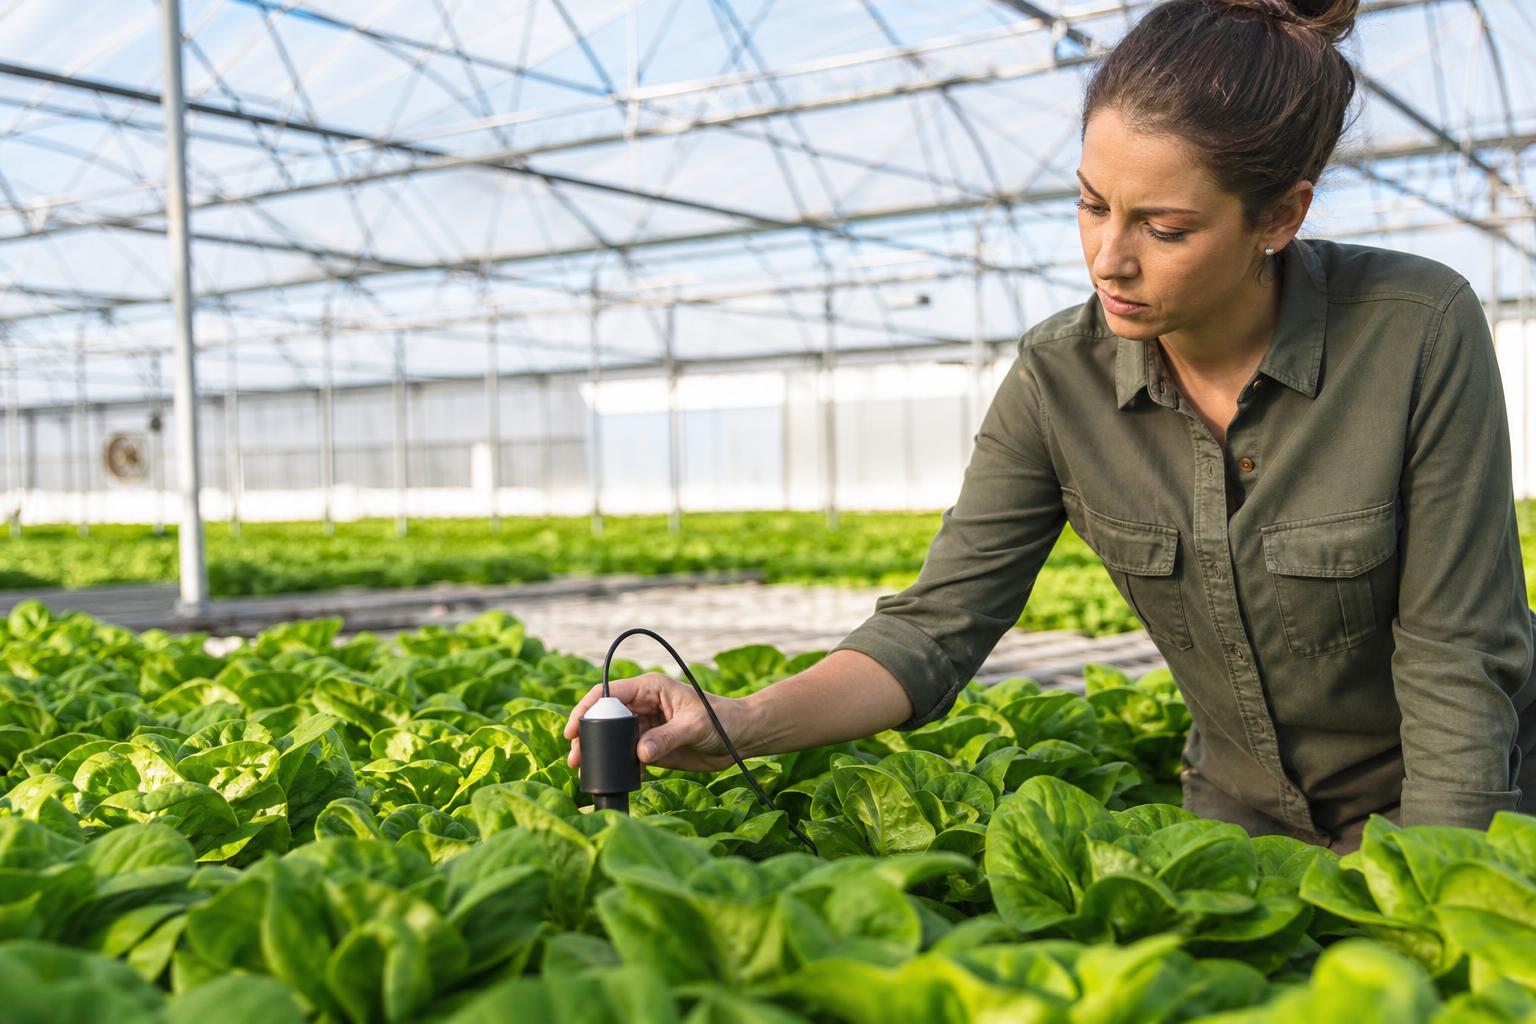
A greenhouse light meter is a handheld or stationary instrument that quantifies the light available to plants inside a greenhouse. What separates it from a standard light meter is what it measures: photosynthetically active radiation, the band of wavelengths between 400 and 700 nanometers that plants use to photosynthesize.
The output is expressed in quantum units, specifically micromoles of photons per square meter per second (µmol/m²/s), a measurement called PPFD (Photosynthetic Photon Flux Density). This is fundamentally different from lux or foot-candle readings, which measure brightness as perceived by the human eye.
That distinction matters more than most growers realize. Dr. Bruce Bugbee of Utah State University put it bluntly: “If the lighting drops in half, the growth drops in half but you think nothing changed because our eyes are not good at perceiving light.” He went further, arguing that a light meter is more important than a pH meter for greenhouse operations.
If you’re evaluating whether your greenhouse delivers enough light, or considering supplemental lighting, accurate measurement is where every good decision starts.
Why Greenhouses Need a Dedicated Light Meter
Greenhouses are not open fields. Glazing materials absorb and reflect a significant portion of incoming sunlight, sometimes 30% to 50% depending on material age, dirt accumulation, and condensation. Structural elements like gutters, trusses, and hanging baskets create shadow patterns that shift throughout the day and across seasons. Weather adds another layer of variability.
All of this means the light hitting your crop canopy is unpredictable and often much lower than what you’d measure outdoors. Your eyes won’t catch it. Human vision adapts to brightness changes so smoothly that a 50% drop in photosynthetic light can go completely unnoticed.
Dr. Timothy Shelford of Cornell University and the GLASE consortium confirms the practical stakes: “If a grower is interested in maximizing their production and has or is considering using supplemental lighting, measuring light (either on a periodic or continuous basis) is almost certainly necessary.”
Without a greenhouse light meter, you are guessing. Supplemental lighting decisions are only as good as the measurement behind them. Understanding how HVAC interacts with your lighting choices also depends on knowing your actual light levels first.
The Right Units: PAR, PPFD, and DLI
Three terms form the measurement framework for greenhouse light. Getting them straight eliminates most of the confusion around light meters.
PAR (Photosynthetically Active Radiation) is the bandwidth, not a unit. It defines the wavelengths between 400 and 700 nm that plants use for photosynthesis. When someone says “PAR meter,” they mean a meter that measures light within this range.
PPFD (Photosynthetic Photon Flux Density) is the instantaneous reading. It tells you how many photons in the PAR range are hitting one square meter of your canopy every second. The unit is µmol/m²/s. Think of it as a speedometer for light.
DLI (Daily Light Integral) is the cumulative total. It sums up all the PPFD your crop receives over a 24-hour period, expressed in mol/m²/day. Think of it as an odometer. The formula is straightforward:
DLI = PPFD × photoperiod (hours) × 3,600 ÷ 1,000,000
Or simplified: DLI = PPFD × hours × 0.0036.
For a deeper walkthrough of these calculations, see our guide on how to calculate DLI from PPFD.
Why Lux and Foot-Candles Mislead in Greenhouses
Lux and foot-candle meters measure photometric light, which is weighted toward the green wavelengths (495 to 570 nm) where human eyes are most sensitive. Plants, on the other hand, use red and blue wavelengths heavily, and those wavelengths are underweighted in photometric readings.
Dr. Shelford explains the problem directly: “Lux and foot-candles are also a measure of intensity, but it’s weighted for how humans perceive light, which is heavily in the green wavelength range. Using a quantum sensor is particularly important if you’re using LED supplemental lighting where the wavelengths are typically a mix of red and blue.”
The error is not trivial. Research reported by Flusmeter found that tomato growers relying solely on lux readings were getting their numbers wrong by about 22%. Under LED fixtures with narrow-band red and blue output, the discrepancy can be even worse. For a fuller discussion of the LED versus HPS measurement trap, see this common comparison mistake.
Types of Greenhouse Light Meters
Five categories of instruments are used in greenhouse settings, ranging from budget smartphone tools to research-grade spectroradiometers.
Handheld Quantum (PAR) Meters
These are the workhorses of greenhouse light measurement. A handheld quantum meter uses a cosine-corrected sensor to read PPFD at a single point. You hold it at canopy level, take a reading, and move to the next position. Prices for units including the sensor and display start around $300 and go up to $1,000 depending on features and accuracy.
Roberto Lopez of Michigan State University Extension recommends confirming three things before purchasing: that the meter reads in quantum units (µmol/m²/s), that it can measure up to full sun (2,000 µmol/m²/s) across the 400 to 700 nm range, and that you know whether it is calibrated for sunlight or a specific light source.
Stationary Quantum Sensors
For continuous monitoring, quantum sensors can be connected to data loggers or integrated directly into greenhouse climate computers. These sensors record PPFD at set intervals throughout the day, automatically calculating DLI. This eliminates the guesswork of spot checks and captures the full picture across weather changes and seasons. Our guide on measuring DLI in a greenhouse covers the setup process in detail.
ePAR Meters (400 to 750 nm)
Traditional PAR meters stop at 700 nm, but research by Drs. Shuyang Zhen and Bruce Bugbee at Utah State University established that far-red photons (700 to 750 nm) interact synergistically with PAR photons during photosynthesis. The extended PAR (ePAR) range of 400 to 750 nm captures this contribution. If you are running modern LED fixtures with intentional far-red output, an ePAR meter gives a more complete picture of what your plants are actually receiving.
Smartphone Apps
Several smartphone apps estimate PPFD using the phone’s camera sensor and a clip-on diffuser. Practitioners on grower forums report that the best of these apps, when paired with the correct diffuser on a recent iPhone, can land within a few percent of professional quantum meter readings. One detailed side-by-side test on the Autoflower Network found that the app readings (207, 195, 339, and 96 µmol/m²/s) actually ran higher than a budget PAR meter (184, 168, 303, and 88), suggesting the cheap hardware meter was systematically undercounting.
The takeaway from experienced growers on forums like percysgrowroom.com is that sensor calibration matters more than price tag. A well-calibrated app can outperform a poorly calibrated $200 meter. That said, apps don’t measure the full spectrum a quantum sensor does, and their accuracy varies significantly between phone models and LED spectra.
Spectroradiometers
These research-grade instruments measure the full spectral distribution of light, not just the total photon count. They tell you exactly how much energy is present at each wavelength. Spectroradiometers are expensive (often several thousand dollars) and mostly used in research settings, breeding programs, and growth chamber work. For most commercial greenhouse operations, a handheld quantum meter or stationary sensor is sufficient.
How to Use a Greenhouse Light Meter Correctly
Taking a reading is simple. Taking a useful reading requires attention to a few details that university extension sources consistently emphasize.
Measure at canopy height. Place the sensor at the level where your plants’ leaves are, not at bench height or overhead. The light intensity plants experience at their canopy is what matters, and it can differ substantially from readings taken even a few inches above or below.
Keep the sensor level. Tilt introduces error. Cosine-corrected sensors are designed to read light arriving from all angles above the horizontal plane, but only when the sensor face is parallel to the ground.
Calibrate for your light source. This is the mistake that trips up the most growers. As Roberto Lopez warns, “If a grower has LED lights but uses a light meter calibrated for high-pressure sodium bulbs, their readings are going to be incorrect. In most instances, it’s going to be lower than what you are actually measuring.” Older quantum sensors are particularly unreliable under deep-red LEDs (above 660 nm), where they can miss a significant fraction of photons. Full-spectrum quantum sensors calibrated for all light sources eliminate this problem.
Avoid interference zones. Do not place sensors under irrigation booms, mist systems, or fogging lines. Water deposits on the sensor diode will skew readings over time. Clean the sensor surface weekly with deionized or reverse osmosis water and a soft cloth.
Map multiple points. A single center reading tells you almost nothing about uniformity. Commercial growers should measure on a grid pattern, typically every 6 to 24 inches depending on fixture mounting height. The uniformity ratio (minimum PPFD divided by average PPFD) should fall between 0.75 and 0.90. Below 0.75, your lighting layout likely needs redesign.
Measure regularly. Lopez recommends measuring “as often as you can,” with once per week as a minimum. Shoulder seasons (fall and spring) bring the fastest changes in natural light, making frequent measurement especially valuable during those periods.
For step-by-step guidance on taking PPFD measurements, see how to measure PPFD in a greenhouse.
Making Sense of the Numbers
A PPFD reading is useful only when compared against what your crop actually needs. The table below shows research-backed DLI targets for common greenhouse crops.
| Crop | DLI Target (mol/m²/day) |
|---|---|
| Lettuce and leafy greens | 12 to 17 |
| Herbs (basil) | 14 to 20 |
| Tomatoes | 20 to 35 |
| Peppers and cucumbers | 20 to 30 |
| Cannabis (flower) | 25 to 40+ |
Sources compiled from university extension programs and controlled environment agriculture research. The key insight from California Lightworks: “Yield increases proportionally with DLI up to a certain upper limit. Above that limit, the yield may continue to go up, but the rate of increase drops off rapidly and plant stress can ensue.”
The Practical Workflow
Once you have meter data, the decision process is straightforward:
- Measure your current DLI using PPFD readings and the formula above.
- Compare against the target DLI for your crop.
- Calculate the deficit. If your greenhouse delivers 12 mol/m²/day of natural light and your tomatoes need 30, you have an 18 mol/m²/day gap to fill.
- Size supplemental lighting to close that gap during your chosen photoperiod.
This is where a greenhouse light meter pays for itself. Light meters “quickly pay for themselves in reduced operating costs and potentially increased revenue, whether from shorter crop cycle times or better quality plants and higher yields,” as Greenhouse Grower reports.
For greenhouse top-lighting solutions designed to deliver specific PPFD targets, the Altus 1K and Pinnacle series are built for exactly this kind of deficit-closing work. Utility rebates can further improve the economics, and current rebate programs are worth checking before finalizing a project.
Common Mistakes
Using a lux meter instead of a quantum meter. This is the most frequent error. Lux meters are cheap and widely available, which makes them tempting. But a 22% error rate (or worse under LEDs) means you’re making lighting decisions based on bad data.
Wrong calibration for your light source. A meter calibrated for high-pressure sodium lamps will undercount photons from LEDs, especially in the deep-red range above 660 nm. Always confirm your meter’s calibration matches the light sources in your greenhouse.
Measuring at the wrong height. Readings taken at bench height or above the canopy do not reflect what plants are experiencing. Always measure at the top of the plant canopy.
Single-point measurement. One reading in the center of the growing area tells you the peak value, not the average or the minimum. Without mapping multiple points, you cannot assess uniformity or identify dead zones.
Ignoring glazing degradation. Greenhouse glazing loses transmissivity over time from dirt, algae, condensation, and material aging. Light levels that were adequate two years ago may not be adequate today. Regular measurement catches this drift.
Skipping warmup time. HID lamps need roughly 15 minutes to reach stable output. Taking readings before warmup creates artificially low numbers. LEDs stabilize faster but should still be given a few minutes.
Frequently Asked Questions
Can I use a regular lux meter in my greenhouse?
You can, but you shouldn’t rely on it for plant-related decisions. Lux meters are calibrated for human vision and underweight the red and blue wavelengths that drive photosynthesis. Under LED lighting, the error can exceed 20%. A quantum (PAR) meter that reads in µmol/m²/s is the correct tool.
How much does a greenhouse light meter cost?
Handheld quantum meters suitable for greenhouse use typically range from $300 to $1,000. Budget hardware meters are available for less, but practitioners on grower forums warn that some cheap PAR meters systematically undercount by around 30%. Smartphone apps with proper diffusers offer a budget alternative for home and small-scale growers.
What is the difference between PPFD and DLI?
PPFD is an instantaneous measurement, like a speedometer reading for light at one moment. DLI is the cumulative total of all photosynthetically active photons delivered to a square meter over 24 hours, like an odometer. You need both: PPFD to set fixture output and DLI to determine if daily crop targets are being met. Our PPFD vs. DLI guide breaks down the relationship in full.
How often should I take light measurements?
At minimum, once per week. Roberto Lopez of MSU recommends measuring “as often as you can.” Continuous monitoring with stationary sensors connected to data loggers is the gold standard for commercial operations, especially during fall and winter when natural light changes rapidly.
Do I need to recalibrate my light meter for LED fixtures?
Yes. If your meter was calibrated for sunlight or HPS and you have switched to LEDs, your readings are likely inaccurate. Full-spectrum quantum sensors calibrated for all light sources avoid this issue entirely. Always check the manufacturer’s calibration specifications before trusting your numbers.
What is ePAR and do I need it?
ePAR (extended PAR) covers 400 to 750 nm, including the far-red wavelengths between 700 and 750 nm. Research has shown these far-red photons synergistically boost photosynthesis when combined with traditional PAR light. If your LED fixtures include intentional far-red output, an ePAR meter gives a more accurate picture. For most standard greenhouse setups, a traditional 400 to 700 nm quantum meter is still sufficient.
How do I connect light meter data to supplemental lighting decisions?
Measure your current DLI, compare it to your crop’s target DLI, and calculate the deficit. That deficit tells you how much supplemental PPFD you need and for how many hours. This is the data that drives fixture selection, layout design, and operating schedules.
Need help translating your light meter data into a supplemental lighting plan? Schedule a free consultation with a lighting specialist.