LED Grow Light Payback Period: 2026 ROI & Savings Guide
Calculate the LED grow light payback period with energy, HVAC, maintenance, rebates, and yield savings. See benchmarks and plan your ROI.
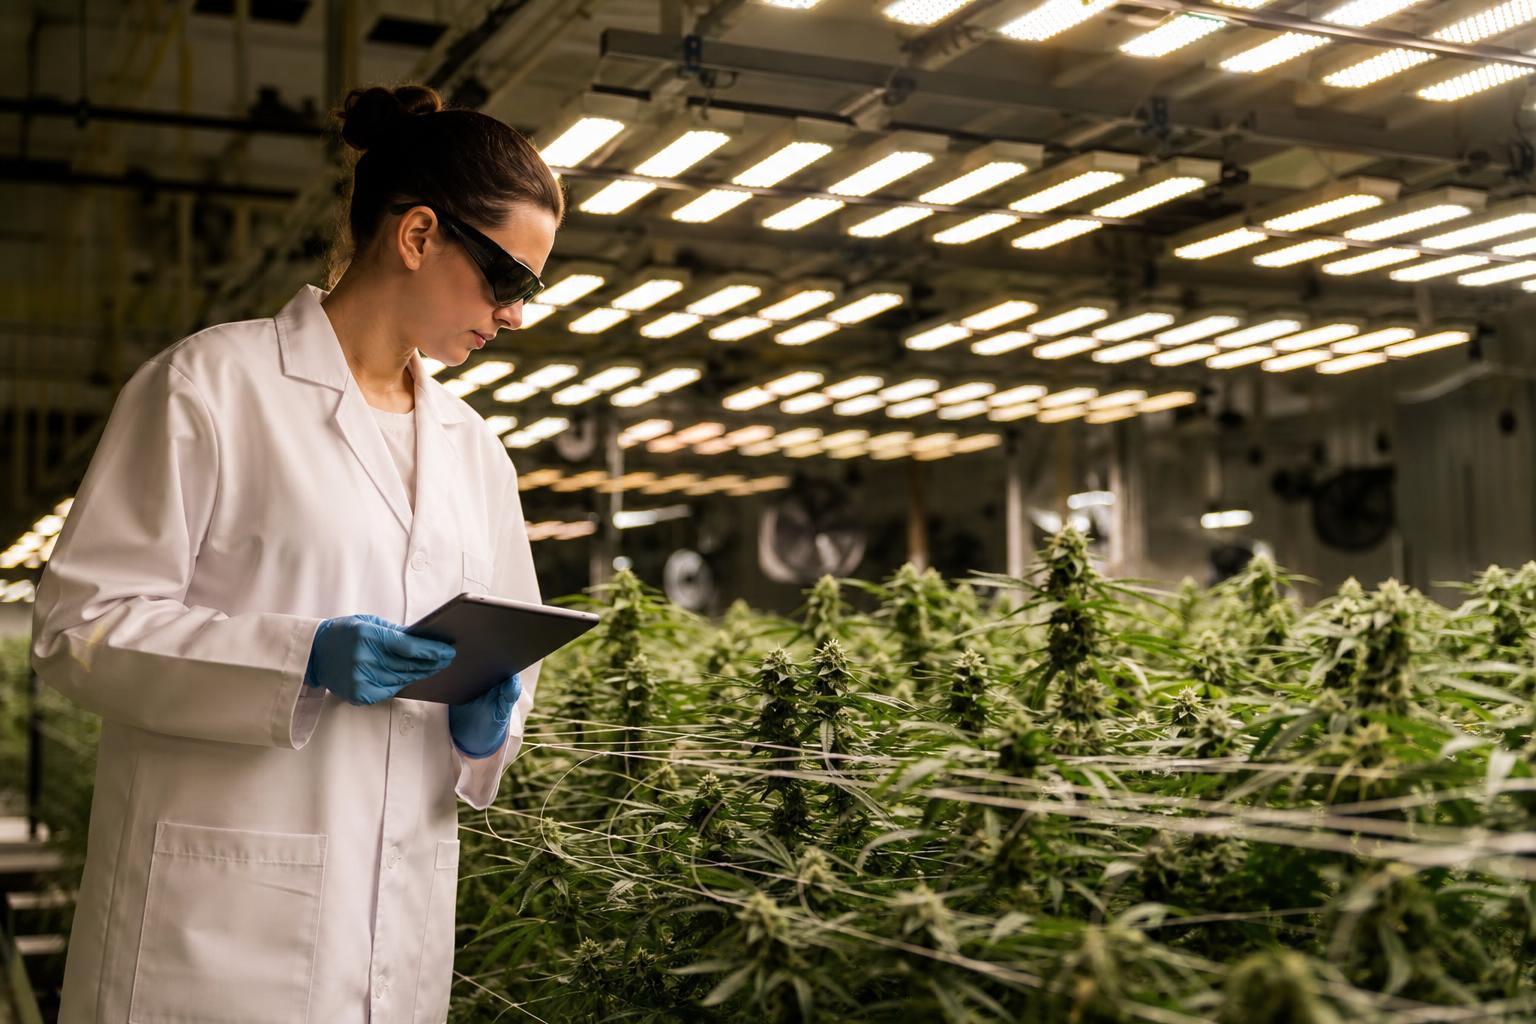
TL;DR: The LED grow light payback period is the time it takes for energy savings, reduced HVAC costs, lower maintenance, and yield gains to recoup your lighting investment. The formula is simple: (Total Project Cost minus Rebates) divided by Annual Net Savings. Most commercial operations see payback in 2 to 4 years, though the number swings significantly based on electricity rates, rebates, operating hours, and whether you account for revenue improvements alongside cost savings.
What Is the LED Grow Light Payback Period?
The LED grow light payback period measures how many months or years it takes for the cumulative financial benefits of an LED lighting system to equal what you paid for it. Once you hit that breakeven point, every dollar of savings or additional revenue is pure return.
The core formula:
Payback Period (years) = (Total Project Cost − Rebates and Incentives) ÷ Annual Net Savings
For most commercial horticulture operations, payback falls in the range of 1.5 to 5 years. A Minnesota CARD study found a payback period of 2.2 years for LED fixtures, with net present value savings of $5,745 in energy and maintenance costs over a five-year lifespan. A DTE Energy pilot project documented a simple payback of 3.46 years for 218 LED grow light fixtures across 3,500 square feet.
These numbers matter because lighting is often the single largest electricity line item in a controlled environment agriculture facility. Getting the payback math right determines whether a project gets funded or shelved.
→ Get a project-specific payback estimate with a free consultation
How to Calculate LED Grow Light Payback: Step by Step
The calculation itself is straightforward. Getting accurate inputs is the hard part.
Step 1: Sum the total project cost
Include fixtures, installation labor, wiring, controls, and any infrastructure upgrades. For large deployments, installation cost can rival fixture cost, so do not overlook it. Centralized power architectures like remote driver systems can lower wiring and installation expenses significantly, which directly compresses the payback timeline.
Step 2: Subtract rebates and incentives
Utility rebate programs can offset 30 to 70 percent of total fixture cost, and some prescriptive programs cover up to 100 percent of lighting costs. This single variable has more power to shorten your payback than almost anything else. But there is a catch: most programs require DLC-listed grow lights to qualify. A fixture that misses the DLC threshold does not get a smaller rebate. It gets nothing.
As of April 2025, DLC horticultural standards require a minimum photosynthetic photon efficacy of 2.5 µmol/J, along with a five-year warranty and demonstrated performance over rated hours. Check your rebate eligibility before purchasing, not after.
Step 3: Calculate annual net savings
This is where most calculations go wrong, because people only count electricity savings. A complete annual savings figure includes four components:
Energy savings from reduced wattage (LED vs. legacy lighting)
HVAC savings from reduced heat output
Maintenance savings from eliminated bulb replacements and reduced fixture servicing
Revenue gains from improved yields and crop quality
Subtract any new costs, such as increased heating in cold climates (more on this below).
Step 4: Divide net cost by annual savings
That gives you the simple payback period in years. Under 3 years is very strong. Three to five years is often attractive. Above five years requires a harder look at whether the project pencils out.
The Three Paybacks: A Framework for Honest Analysis
One reason payback estimates vary so wildly is that different people include different things in the denominator. It helps to think in terms of three distinct payback calculations.
Energy-only payback (longest)
This counts only the kilowatt-hour reduction from switching to more efficient fixtures. It is the most conservative estimate and the one vendors sometimes use when they want to appear cautious. For a typical HPS-to-LED conversion, energy-only payback runs 3 to 5+ years depending on electricity rates.
Full-savings payback (shorter)
Add HVAC reductions and maintenance savings to the denominator. Facilities that transition from HPS to LED routinely report HVAC cooling cost reductions of 30 to 40 percent. One analysis found that LEDs eliminate roughly 0.3 to 0.5 kWh of cooling load for every 1.0 kWh of lighting load reduced. Maintenance savings from skipping bulb swaps and ballast replacements can add $5,000 or more annually for a mid-size operation. This version of payback typically runs 2 to 4 years for greenhouses with rebates.
Revenue-adjusted payback (shortest)
When you include yield improvements, quality premiums, and crop consistency gains in the annual benefit, payback compresses further. Adding a 15 to 20 percent revenue gain to the denominator alongside energy savings can shorten payback by one to two years for most mid-size greenhouse operations. Under-canopy lighting, for example, adds light below the canopy without proportional power increases, creating a revenue-side payback accelerator that pure efficiency math misses.
The most accurate payback calculation captures every measurable financial impact the lighting system creates. Growers who only look at energy savings underestimate the return.
What Affects Your LED Grow Light Payback Period
Five variables move the needle more than anything else.
Electricity rate
A facility paying $0.20/kWh will see payback roughly twice as fast as one paying $0.10/kWh, all else equal. This is why operations in California, Massachusetts, and Ontario often see the fastest returns. Practitioners on grower forums frequently note that energy savings alone justify the investment only when electricity is expensive enough. As one grower put it, “If it wasn’t for the power savings I’d never pay that much for LED lights.”
Operating hours and photoperiod
Cannabis flower rooms running 12-hour photoperiods accumulate savings slower than greenhouse supplemental lighting running 16+ hours per day in winter. Vertical farms running 16 to 20 hours daily see even faster accumulation. More hours equals more kWh saved per year.
Fixture efficacy
Quality LED fixtures deliver 2.5 to 3.0 µmol/J versus roughly 1.0 to 1.7 for HPS, turning more electricity into usable light while generating less waste heat. But spec-sheet efficacy is not the whole story. A lower-efficacy system with 92% canopy uniformity will consistently outperform a higher-efficacy system with 70% uniformity, because uneven light means uneven growth and wasted photons. Payback analysis must account for real-world light delivery. Look at uniformity metrics, not just peak µmol/J numbers.
Utility rebates
This is the single biggest lever for compressing payback. A facility replacing 50 HPS fixtures with DLC-certified LEDs might recover $15,000 to $40,000 depending on wattage difference and the utility program. Explore greenhouse lighting incentives early in your planning, since many programs require pre-approval before you buy fixtures.
HVAC load reduction
The most commonly underestimated variable. By removing hundreds of watts of waste heat per fixture from the grow space, LEDs cut cooling costs substantially. In multi-tier vertical farms and large greenhouse installations, HVAC savings alone can shift the payback period forward by a full year. For a deeper breakdown, see this guide on HVAC sizing for LED grow lights.
Typical Payback Ranges by Application
Application | Typical Payback (with rebates) | Notes |
|---|---|---|
Greenhouse supplemental lighting | 2–4 years | Higher utility rates compress further |
Indoor cannabis (HPS to LED retrofit) | 2–3.5 years | High operating hours accelerate savings |
Vertical farm (new build) | 2–3 years | No HPS baseline, but high utilization |
New construction (no legacy comparison) | 3–5+ years | No energy delta, so payback is slower on paper |
These ranges assume DLC-listed fixtures and successful rebate capture. Without rebates, add 1 to 3 years.
Worked Example: 10,000 Sq Ft Indoor Grow Room
Here is a representative calculation based on published pilot data and industry benchmarks:
Facility: 10,000 sq ft commercial grow room
Fixtures: 200 × 640W LED replacing 200 × 1000W HPS
Electricity rate: $0.12/kWh
Photoperiod: 12 hours/day, 365 days/year
Annual energy savings (lighting): ~$31,500
HVAC savings: ~$10,000
Maintenance savings: ~$5,000/year (no bulb swaps, no ballast replacements)
Total annual savings: ~$46,500
Fixture cost: $200,000
Utility rebates: −$60,000
Net project cost: $140,000
Simple payback: approximately 3.0 years
If this facility also captures a 15% revenue increase from better light quality and canopy uniformity, annual gains climb above $60,000, and payback drops closer to 2.3 years.
Source data adapted from the DTE Energy pilot project and Aelius LED’s step-by-step payback guide.
Simple Payback vs. Life-Cycle Cost Analysis: Know the Difference
This is the most important nuance in LED grow light payback calculations, and the one most frequently ignored.
Simple payback divides net project cost by annual savings and calls it done. It ignores the time value of money, energy price escalation, fixture degradation, and replacement costs. It is useful as a screening tool, not a decision-making tool.
A 2025 study published in HortTechnology found that across several greenhouse supplemental lighting case studies, simple payback predicted breakeven roughly 3 years earlier than a full life-cycle cost analysis (LCCA). That is a significant gap. A project that looks like a 3-year payback under simple math might actually break even at year 6 under LCCA.
Electrical professionals on forums like Mike Holt’s consistently push back on simple payback as insufficient. As one commenter noted, “You need to do a Life Cycle Cost Analysis in order to get the entire picture.”
The practical rule: Use simple payback as a first filter. If simple payback exceeds 5 years, the project probably will not survive a deeper analysis. If it clears that bar, run an LCCA before committing capital. For more on reducing operating expenses through smarter capital planning, that linked guide covers the broader picture.
The Cold-Climate Heating Penalty
Almost every LED payback guide glosses over this, but it matters for northern greenhouses.
HPS fixtures produce significant waste heat, and in cold climates, that heat offsets part of the heating load. When you switch to LEDs, you lose that free heat. Your heating bill goes up in winter, even as your cooling bill drops the rest of the year.
This does not make LED conversion a bad idea. It makes the heating change a line item in the calculation instead of an omission, and it is usually large enough to matter. For greenhouse operations in northern climates, always include the increased heating cost in your LCCA. Ignoring it inflates your projected savings and makes the payback period look shorter than it really is.
Fixture Reliability: Payback Insurance You Cannot Skip
If a fixture fails before payback is reached, the math breaks. Every warranty claim, every replacement, and every day of downtime in a live grow erodes the financial case.
This is why reliability data matters in payback analysis. A fixture with a sub-1% failure rate over a 5-year warranty period protects the payback projection. A bargain fixture with a 10% failure rate in year two does not. Tight design-to-install accuracy (for example, ±5% PPFD variance from the original light plan) also de-risks the assumptions baked into the calculation.
Grower communities on Reddit and forums like TractorByNet express consistent skepticism about vendor payback claims, often citing fixture reliability as the weak link. Cheap fixtures that fail early are the fastest way to turn a 3-year payback into a 5-year payback, or worse.
→ See how commercial growers achieved payback in practice
How to Shorten Your LED Grow Light Payback Period
Six practical moves, ranked roughly by impact:
Capture every available rebate. Apply before purchasing, choose DLC-listed fixtures, and work with your utility’s program requirements from the start.
Count HVAC savings. If you are only counting energy, you are leaving 20 to 30% of the annual benefit off the table.
Evaluate centralized power architectures. Moving LED drivers out of the grow space reduces installation cost, lowers HVAC load, and can improve fixture reliability, three payback variables in one design decision. Learn more about OptiDrive.
Add under-canopy lighting for yield gains. Rather than increasing total top-light power, under-canopy LED bars can boost lower-canopy yield by 20 to 30% without proportional energy increases.
Choose fixtures with proven reliability. A five-year warranty and documented low failure rates protect your payback assumptions over the full investment horizon.
Run site-specific numbers. As MSU Extension researcher Erik Runkle has noted, “The return on investment of LEDs is highly situational, and so analyses should be performed using realistic values specific to your operation.”
→ Book a free 15-minute consultation for a project-specific payback estimate
FAQ
What is a good payback period for LED grow lights?
Under 3 years is considered very strong. Three to five years is often attractive for commercial operations. If simple payback exceeds 5 years, the project warrants closer scrutiny through a full life-cycle cost analysis before committing.
How do you calculate LED grow light payback?
Divide your net project cost (total fixture and installation cost minus rebates) by your annual net savings (energy savings plus HVAC savings plus maintenance savings plus any yield-based revenue gains, minus increased heating costs if applicable). The result is payback in years.
Do utility rebates affect the LED grow light payback period?
Enormously. Rebates can offset 30 to 70 percent of fixture cost, and some programs cover up to 100 percent. Since rebates reduce the numerator of the payback formula, they compress payback more directly than almost any other variable. However, most programs require DLC-listed fixtures to qualify.
What is the difference between simple payback and LCCA?
Simple payback divides cost by annual savings and ignores the time value of money, energy price changes, and fixture replacement costs. Life-cycle cost analysis accounts for all of these. Research shows simple payback can underestimate true breakeven by approximately 3 years. Use simple payback as a quick screen, then run LCCA for the actual capital decision.
How does fixture efficacy affect payback?
Higher efficacy (measured in µmol/J) means more usable light per watt of electricity, which directly increases energy savings. Modern LEDs deliver 2.5 to 3.8 µmol/J compared to 1.0 to 1.7 for HPS. But efficacy only matters if the light reaches the canopy evenly. Poor uniformity wastes the efficiency advantage.
Does switching to LED increase heating costs?
In cold climates, yes. HPS fixtures produce waste heat that offsets part of the heating load. Removing that heat source means your heating system works harder in winter. This “heating penalty” should be a line item in any honest payback calculation for northern greenhouse operations.
How long do LED grow lights last compared to HPS?
LED fixtures are rated for 50,000+ hours, compared to 10,000 to 24,000 hours for HPS lamps. This lifespan advantage means fewer replacements, lower maintenance labor, and more predictable performance over the payback period and beyond.