Greenhouse Lighting Payback: 2026 ROI Guide + 8 Keys
Calculate greenhouse lighting payback, compare simple vs LCCA, and see 2026 rebates, HVAC and controls that speed ROI. Get expert guidance.
TL;DR
Greenhouse lighting payback is the time it takes for a lighting investment to recover its cost through energy savings, lower maintenance, and increased crop revenue. The simple formula is (Project Cost minus Rebates) divided by Annual Net Savings. Most commercial LED upgrades pay back in 18 months to 5 years, but the calculation method you choose matters enormously. Simple payback can underestimate the true breakeven by roughly 3 years compared to a full life-cycle cost analysis.
Evaluating a lighting upgrade for your greenhouse? Request a consultation to model payback for your specific operation.
Quick Answer: What Is the Typical Greenhouse Lighting Payback in 2026?
Most commercial greenhouse LED projects achieve payback within 18 months to 5 years.
The typical breakdown looks like this:
Greenhouse Type | Expected Payback |
|---|---|
High-value crops with rebates | 18-24 months |
Standard commercial greenhouse | 2-3 years |
Cold-climate greenhouse | 3-5 years |
Greenhouse without rebates | 4-5 years |
Four variables have the greatest effect on payback:
Electricity rates
Fixture efficiency (µmol/J)
Utility rebates
Crop revenue
Simple payback calculators provide a quick estimate, but life-cycle cost analysis (LCCA) produces a more accurate projection because it includes financing costs, maintenance, energy price increases, and equipment replacement.
Takeaway: Most greenhouse operators should target a simple payback of three years or less before moving forward with an LED upgrade.
What “Greenhouse Lighting Payback” Actually Means
Greenhouse lighting payback is the number of years (or months) it takes for a lighting investment to pay for itself. If you spend $200,000 on new LED fixtures and those fixtures generate $80,000 per year in combined savings and revenue gains, your payback period is 2.5 years. Everything after that is profit.
It is the single most common metric greenhouse operators use to evaluate whether a lighting upgrade is worth the capital outlay. It shows up in board presentations, loan applications, and internal planning documents. When growers say a project “pencils out,” they are usually referring to the payback period falling within an acceptable window.
The basic formula:
Payback Period (years) = (Total Project Cost − Rebates) ÷ Annual Net Savings
“Annual Net Savings” is where most of the complexity lives. It should include direct energy cost reduction, maintenance savings (no more lamp replacements), HVAC savings from reduced heat load, revenue gains from yield and quality improvements, and any heating penalty in cold climates where LEDs produce less waste heat than the fixtures they replace.
Typical Payback Ranges
Most commercial greenhouse LED projects land between 18 months and 3 years. A study funded through a Minnesota Department of Commerce CARD grant found that LED fixtures achieved 43% energy savings compared to HPS with an estimated payback period of 2.2 years. Industry-wide, the range stretches from 1.5 to 5 years depending on electricity rates, rebate availability, operating hours, and crop value. A CEA World report quotes an industry specialist setting the target at up to a five-year payback that accounts for electrical savings, yield improvement, and quality tied to revenue.
For a deeper look at how supplemental lighting fits into greenhouse operations, see this supplemental lighting guide.
Example: A 10,000-Square-Foot Greenhouse LED Payback Calculation
The following example shows how a simple greenhouse lighting payback calculation works.
Cost Category | Amount |
|---|---|
LED fixture investment | $240,000 |
Utility rebates | -$60,000 |
Net project cost | $180,000 |
Annual energy savings | $48,000 |
HVAC savings | $10,000 |
Maintenance savings | $7,000 |
Additional crop revenue | $15,000 |
Total annual benefit | $80,000 |
Simple payback:
($180,000 ÷ $80,000) = 2.25 years
This example uses simple payback only. A complete financial model should also include financing costs, energy inflation, driver replacements, and equipment depreciation.
Simple Payback vs. Life-Cycle Cost Analysis: The Most Common Mistake
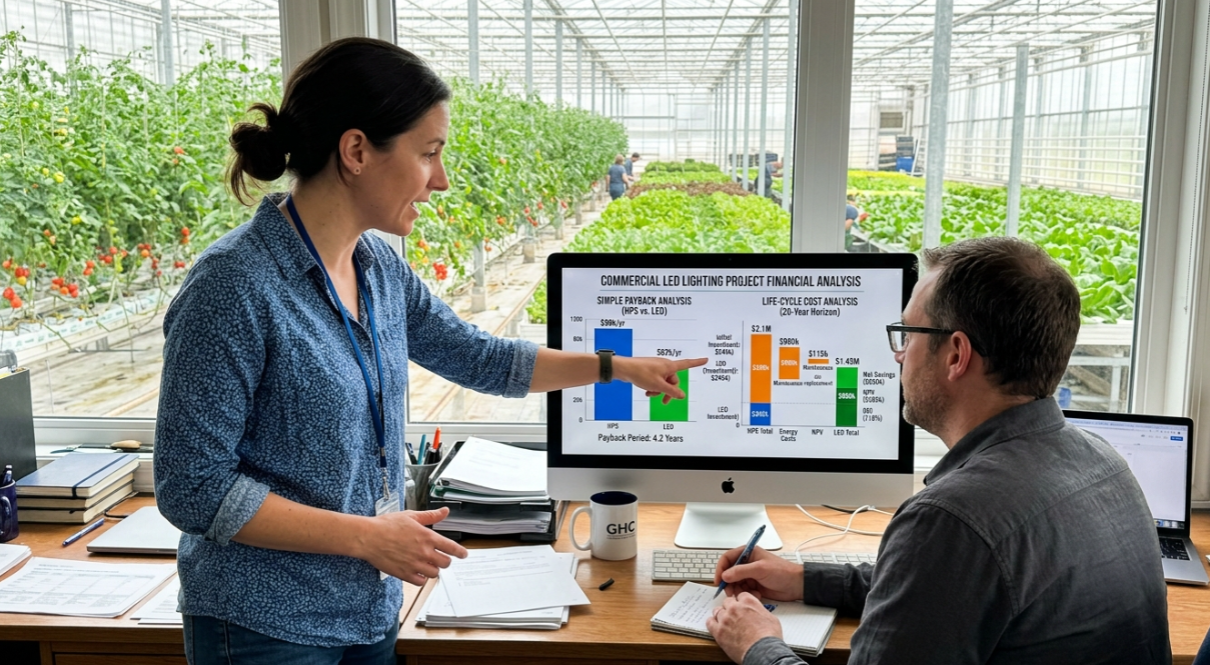
Here is where greenhouse lighting payback calculations get dangerous. The formula above is called “simple payback,” and it is the version that appears on nearly every vendor calculator and product spec sheet. It is fast, easy to understand, and it flatters the numbers.
A 2025 peer-reviewed paper in HortTechnology (published by the American Society for Horticultural Science) exposed how misleading simple payback can be. Across several case studies of greenhouse supplemental lighting systems, simple payback predicted breakeven 3 years earlier than the life-cycle cost analysis (LCCA) prediction. In some cases, the project never became profitable within the building’s estimated lifespan.
Why the gap? LCCA accounts for factors that simple payback ignores: the time value of money, energy price escalation, driver replacement costs, and maintenance expenses that compound over a 10 to 15 year fixture life. Simple payback treats a dollar saved in year seven the same as a dollar saved in year one, which is financially unrealistic.
When to use which method: Simple payback is fine for initial screening. If a project doesn’t clear a 5-year simple payback, it probably won’t survive a deeper analysis. But final go/no-go decisions should always use LCCA. If a vendor only provides simple payback numbers and resists sharing LCCA projections, that’s a signal worth paying attention to.
For more on the pitfalls of comparing lighting technologies, read about common mistakes when comparing LEDs to HPS.
Simple Payback vs. Life-Cycle Cost Analysis
Factor | Simple Payback | LCCA |
|---|---|---|
Energy savings | ✓ | ✓ |
Maintenance | ✓ | ✓ |
Driver replacement | ✗ | ✓ |
Financing | ✗ | ✓ |
Inflation | ✗ | ✓ |
Time value of money | ✗ | ✓ |
Best use | Initial screening | Final investment decisions |
The 10 Numbers You Need Before Calculating Greenhouse Lighting Payback
Before running any ROI model, collect these numbers.
Input | Example |
|---|---|
Electricity rate | $0.16/kWh |
Fixture quantity | 300 |
Existing fixture wattage | 1,000W |
New fixture wattage | 650W |
Daily operating hours | 16 |
Annual operating days | 300 |
Utility rebate | $45,000 |
HVAC savings | $12,000 |
Maintenance savings | $6,500 |
Yield increase | 12% |
Without these inputs, any payback estimate is only a rough approximation.
The Variables That Determine Your Greenhouse Lighting Payback
Payback is not a fixed number. It shifts based on at least eight variables, some obvious and some routinely overlooked.
Electricity Rate and Daily Operating Hours
This is the biggest lever. In areas with electricity tariffs above $0.15 per kWh, the financial payback of an energy-efficient upgrade accelerates significantly. A hydroponic facility running lights for 18 hours a day will recoup its investment much faster than a greenhouse using supplemental light for only 4 hours a day during winter months. Multiply those rate and hour differences across hundreds of fixtures and thousands of square feet, and the payback gap between two otherwise identical operations can be years.
Fixture Efficacy: The µmol/J Gap
Modern LED fixtures deliver 2.5 to 3.0 µmol/J of photon efficacy, compared to 1.7 to 1.9 µmol/J for HPS. The U.S. Department of Energy’s Integrated Lighting Campaign documents a 24 to 30 percent reduction in electricity consumption when greenhouses switch from HPS to LED. That efficacy gap is the engine of energy savings and, by extension, payback. The Altus 1K greenhouse fixture is one example of a high-efficacy LED top light designed for this kind of upgrade.
For a detailed comparison of the two technologies, see this LED vs. HPS greenhouse lighting guide.
HVAC Savings (Often Underestimated)
A 1,000W HPS fixture produces roughly 3,400 BTUs of heat per hour, with much of that directed onto the plant canopy. In a greenhouse with hundreds of fixtures, the aggregate heat load is staggering. LED systems reduce peak cooling demands by an estimated 30 to 40 percent, which translates to lower HVAC equipment sizing, reduced electricity for cooling, and fewer maintenance cycles on mechanical systems.
One cannabis facility reported cutting HVAC infrastructure investment by $1.4 million by choosing LED over HPS from the start. These cooling savings are real money, and they belong in the payback calculation. For help sizing HVAC for an LED installation, this guide on HVAC requirements for LED lights walks through the math.
The Heating Penalty in Cold Climates
This is the variable that catches cold-climate greenhouse operators off guard. LEDs produce far less waste heat than HPS fixtures, so heating systems must compensate during winter months. Research from Wageningen University found that while LEDs reduce lighting energy demand by 40%, they increase heating demand, resulting in a net total energy saving of 10 to 25% for most scenarios.
The net energy balance is still positive, but the heating cost must be modeled explicitly. Ignoring it will make your greenhouse lighting payback projections look better than reality.
How Climate Changes Greenhouse Lighting Payback
Climate | LED Lighting Savings | Heating Impact | Typical Payback |
|---|---|---|---|
Warm climate | High | Minimal | 18-30 months |
Temperate climate | Moderate | Moderate | 2-4 years |
Cold climate | Reduced | Significant | 3-5 years |
Utility Rebates and Incentives
Rebates are the fastest way to compress payback timelines. Transitioning from HPS to LED can offset 30 to 70 percent of total fixture cost through utility rebates, with some prescriptive programs covering up to 100% of lighting costs. Canadian programs offer up to $1,000 CAD per fixture in certain provinces.
There is a critical procedural detail that many operators learn the hard way: retroactive rebates are almost nonexistent in 2026. If you install fixtures before receiving pre-approval from your utility program, you forfeit the incentive. The average pre-approval timeline runs about 22 days in North America, so factor that into your project schedule.
Most utility programs require DLC-listed LED grow lights to qualify for rebates. About 70 percent of commercial lighting programs across North America (nearly 700 in total) rely on the DLC Qualified Products List to verify eligibility. To check what rebates apply to your project, explore available rebates here.
The 179D Tax Deduction
The 179D commercial building energy efficiency tax deduction applies to qualifying lighting projects and stacks on top of utility rebates. The deduction can be worth $0.50 to $5.00 per square foot of building area for qualifying improvements. This is often missed in greenhouse lighting payback calculations because growers think of 179D as a “building” deduction, not a “lighting” deduction. Talk to your accountant before finalizing project costs.
Smart Controls and DLI-Based Dimming
Layering a DLI-based dimming strategy on top of LED fixtures cuts energy usage by an additional 20 to 30 percent beyond the fixture swap itself. UGA researchers found that adaptive lighting control can reduce supplemental lighting electricity use by up to 60% with negligible effect on crop growth. That finding is remarkable: you can cut your lighting energy bill by more than half just by dimming intelligently based on incoming sunlight, without any measurable yield penalty.
Yield and Quality Revenue Gains
Energy savings get most of the attention in greenhouse lighting payback discussions, but revenue gains from better yields and higher quality can be equally significant. MSU Extension researcher Erik Runkle notes that the economics of supplemental lighting are most favorable when light is provided to young plants (plugs and liners), because the cost per plant is relatively small at that stage. For many crops, the value of supplemental lighting diminishes once natural DLI reaches 12 to 15 mol/m²/day.
This means payback math should be crop-specific and season-specific, not averaged across the entire year.
Driver Lifespan: The Hidden Maintenance Cost
LED diodes are typically rated to last 50,000 hours. At 2,000 to 3,000 hours of use per year, that translates to roughly 15 years of fixture life. But LED drivers, the electronic components that regulate power to the diodes, have a shorter lifespan of five to seven years and will likely need at least one replacement during the fixture’s life. Most simple payback calculators ignore this cost entirely, which artificially shortens the projected payback period.
This is one reason centralized power architecture changes the greenhouse lighting payback math. By relocating drivers out of the grow space and into a centralized rack, you reduce the number of in-room failure points, simplify maintenance access, and extend effective driver life by keeping them in cooler, cleaner environments. The OptiDrive remote power system is built around this concept, available in DC and DE configurations for new builds and retrofits respectively.
Why “More Light” Doesn’t Always Mean Better Payback
Growers naturally assume that more photons equal more yield, and that more yield equals faster payback. The real-world data says otherwise.
A CEA World article from August 2026 shared a telling story. In 2022, the production controller at The Chef’s Garden in Huron, Ohio, turned his supplemental lights on and left them on. His basil and microgreens germinated well, but then growth stalled. It wasn’t until the team shut the lights off that the plants took off again. The problem was overlighting, which can be just as damaging to yield as underlighting.
A controlled trial in Southern Oregon reinforced this finding. One facility ran four identical flower rooms at 38, 42, 46, and 50 DLI. The 50 DLI room produced only 3% more dry weight than the 42 DLI room but consumed 23% more lighting energy. Their cost of production actually rose.
The takeaway for greenhouse lighting payback: right-sizing your light levels to crop-specific DLI targets improves payback more than maximizing intensity. Every unnecessary photon is wasted electricity with no revenue return.
Under-Canopy and Interlighting: A Separate Payback Calculation
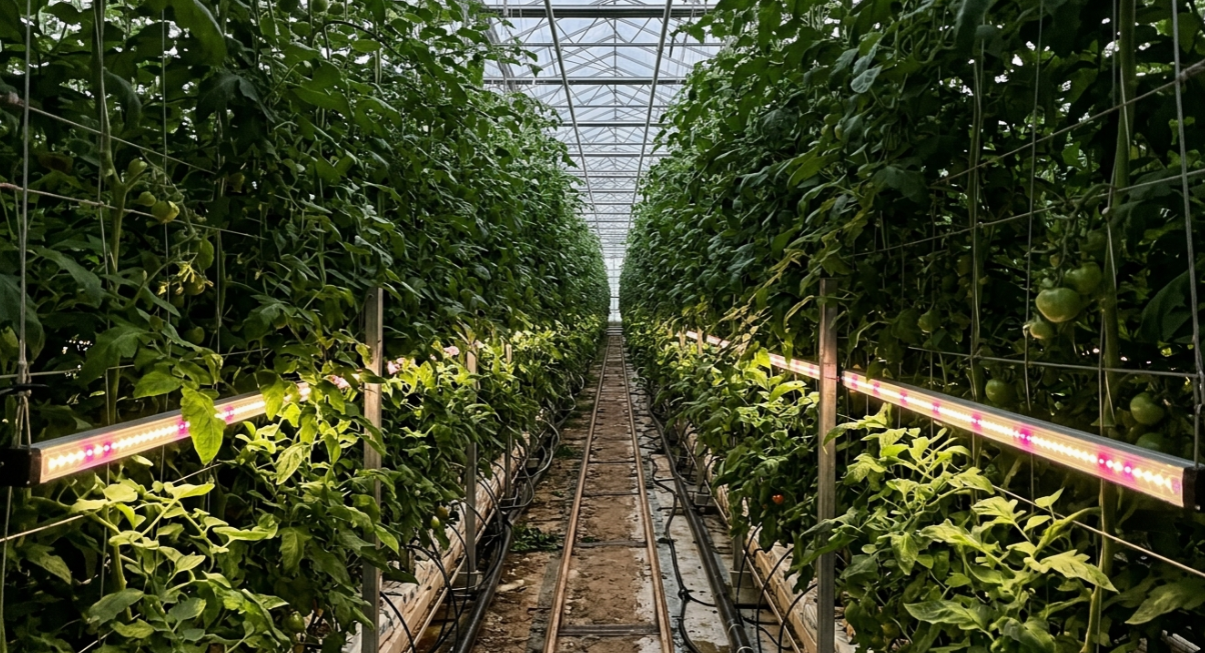
Under-canopy lighting deserves its own payback analysis because the economics are fundamentally different from top lighting. Combining toplighting with interlighting or under-canopy fixtures can boost yields 20 to 30 percent by delivering photons to lower canopy zones that top lights cannot reach.
The key is that under-canopy fixtures are low wattage, typically 60 to 150 watts per bar. The incremental energy cost is modest, but the marginal yield gain is substantial. For operations that already have top lighting optimized, adding under-canopy lighting often produces the fastest payback of any lighting investment in the facility.
The Boost XE is a 120W under-canopy bar designed for this application, compatible with centralized power systems to keep the in-room hardware minimal.
Greenhouse Lighting ROI vs. Payback: What's the Difference?
Payback and ROI are often treated as interchangeable terms, but they measure different things.
Payback measures how long it takes to recover the initial investment.
ROI measures the total financial return generated by the investment.
The formulas are different:
Payback
(Project Cost − Rebates) ÷ Annual Savings
ROI
(Total Profit ÷ Project Cost) × 100
A lighting project can have a short payback period and still deliver a relatively modest long-term ROI. Likewise, a project with a longer payback period can produce significantly greater profits over a 15-year fixture lifespan.
For investment decisions, greenhouse operators should evaluate both metrics together.
Common Mistakes That Extend Greenhouse Lighting Payback
These errors show up repeatedly in project post-mortems:
Installing before rebate pre-approval. This is the most expensive mistake on the list. It can forfeit tens of thousands of dollars in incentives.
Relying on vendor simple payback calculators without LCCA cross-checking. Simple payback can underestimate true breakeven by 3 years or more, as the 2025 HortTechnology research demonstrated.
Ignoring the heating penalty. In cold climates, failing to model the additional heating cost inflates projected savings and extends actual payback.
Not factoring driver replacement into total cost of ownership. A driver swap at year six or seven is a real expense that belongs in the calculation.
Overlighting beyond crop DLI ceilings. Pushing light levels past the point of diminishing returns wastes energy without meaningful yield gains.
Treating all crops and seasons equally. Payback varies by crop value, photoperiod, and natural DLI availability. A single annual average obscures the real economics.
How to Get Started
Building an accurate greenhouse lighting payback model requires gathering a few key inputs: your utility rate, current fixture count and type, daily photoperiod by season, recent utility bills, and crop production records. Check DLC listing and rebate eligibility before selecting fixtures, not after. And request both simple payback and LCCA projections from any vendor you evaluate.
Ready to model the payback for your specific greenhouse project? Get in touch with a lighting specialist to walk through the numbers.
Frequently Asked Questions
What is a good greenhouse lighting payback period?
Most commercial greenhouse operators target 18 months to 3 years for an LED upgrade, though up to 5 years is considered acceptable for projects with strong yield and quality gains. Anything beyond 5 years should prompt a closer look at the assumptions.
How do utility rebates affect greenhouse lighting payback?
Rebates can offset 30 to 70 percent of fixture costs, dramatically compressing payback timelines. In some Canadian provinces, rebates reach $1,000 CAD per fixture. The critical step is securing pre-approval before installation, since retroactive rebates are essentially unavailable in 2026.
What is the difference between simple payback and life-cycle cost analysis?
Simple payback divides net project cost by annual savings and ignores the time value of money, energy price changes, and replacement costs. LCCA accounts for all of these, producing a more realistic (and usually longer) payback estimate. A 2025 HortTechnology study found simple payback can underestimate true breakeven by approximately 3 years.
Do LED lights really save 40% on greenhouse energy costs?
LEDs reduce lighting energy demand by about 40% compared to HPS. However, in cold climates, the lost waste heat means heating systems work harder, bringing net total energy savings to 10 to 25% according to Wageningen University research. The savings are real but vary by climate and facility design.
Does under-canopy lighting have a different payback than top lighting?
Yes. Under-canopy fixtures use low wattage (60 to 150W per bar) but can boost yields 20 to 30 percent by reaching lower canopy zones. The low incremental energy cost combined with substantial yield gains often makes under-canopy additions the fastest-payback lighting investment in a greenhouse.
How does the heating penalty affect LED payback in cold climates?
LEDs produce far less waste heat than HPS fixtures. In cold-climate greenhouses, heating systems must compensate for the lost thermal output. This reduces but does not eliminate the net energy savings. The heating penalty must be modeled explicitly to avoid overstating payback speed.
What is the 179D tax deduction and does it apply to greenhouse lighting?
The 179D commercial building energy efficiency tax deduction applies to qualifying lighting upgrades and can be worth $0.50 to $5.00 per square foot. It stacks on top of utility rebates, further reducing the effective project cost and shortening payback. Consult a tax professional to confirm eligibility for your specific project.
Why do LED driver replacements matter for payback calculations?
LED diodes last roughly 50,000 hours (about 15 years at typical greenhouse use rates), but drivers last only five to seven years. At least one driver replacement is likely during the fixture’s life. Most simple payback calculators ignore this cost, making the projected payback look shorter than it actually is.