Commercial Grow Room Lighting Design: 2026 Guide & Glossary
Learn Commercial Grow Room Lighting Design fast: a 2026 glossary of PPFD, DLI, uniformity, HVAC, and rebates—benchmarks by stage included.
TL;DR
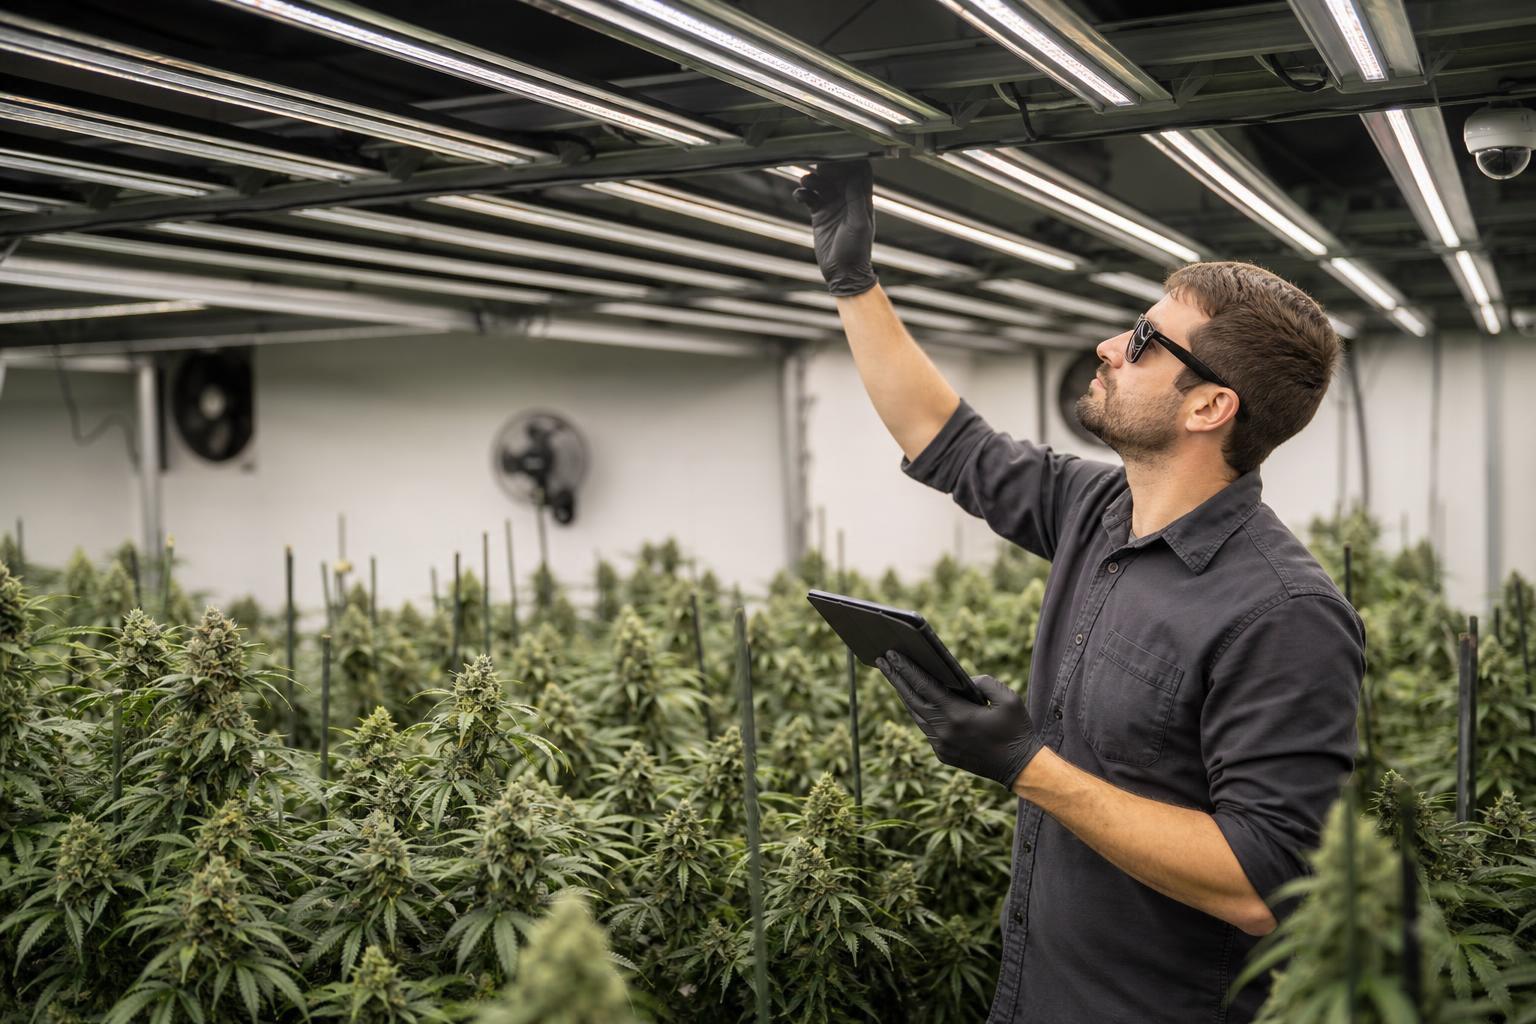
Commercial grow room lighting design is the process of selecting, positioning, and controlling horticultural fixtures to deliver the required light intensity, daily light integral (DLI), and canopy uniformity for a specific crop. A successful design starts with usable canopy dimensions, crop-specific light targets, fixture photometric data, and mounting constraints. Designers then model fixture spacing and height, verify electrical capacity and HVAC requirements, and measure canopy-level PPFD after installation. The goal is consistent crop lighting with predictable energy use, manageable heat loads, and measurable operating costs.
Commercial grow room lighting design combines horticultural science, photometric planning, electrical engineering, and environmental control. The objective is to deliver the right amount of light across the productive canopy while accounting for crop requirements, fixture efficiency, mounting height, power capacity, and cooling demand.
A reliable design does more than achieve a target PPFD beneath individual fixtures. It accounts for the average light level across the canopy, variation between measurement points, daily light integral (DLI), and the cost of operating and maintaining the system.
This guide explains the essential lighting metrics, fixture-layout principles, electrical and HVAC considerations, commissioning procedures, and technical terms used when planning or upgrading a commercial grow room.
Explore commercial LED grow lights built for the benchmarks described below.
How Do You Design Commercial Grow Room Lighting?
Commercial grow room lighting is designed by measuring the productive canopy area, establishing crop-specific PPFD and DLI targets, selecting fixtures with verified photometric data, and modeling their spacing and mounting height. The design must also account for canopy uniformity, electrical capacity, heat removal, controls, and maintenance access. After installation, measure PPFD across a canopy-level grid and adjust fixture positioning or dimming to verify that the system meets the design targets.
The key principle: Design for measured light delivery across the canopy, not fixture wattage or peak output alone.
Commercial Grow Room Lighting Design: Step-by-Step Process
A commercial grow room lighting plan should be based on crop requirements, usable canopy area, verified fixture performance, room geometry, and the facility's electrical and cooling capacity. Use the following workflow to develop and validate a lighting layout.
Step 1: Measure the Productive Canopy Area
Record the room's length, width, ceiling height, structural obstructions, aisle dimensions, and intended canopy footprint. Separate productive growing space from walkways, equipment zones, and other areas that do not require the same light intensity as the crop.
The usable canopy area determines where fixtures should deliver their target PPFD. Do not calculate fixture quantities from total room floor area alone.
Step 2: Establish PPFD and DLI Targets
Choose light targets based on crop species, cultivar, growth stage, photoperiod, and growing conditions. PPFD describes instantaneous photon intensity, while DLI measures the accumulated light received over the day.
Use crop-specific recommendations as starting points, then validate them against cultivar response, environmental conditions, and production goals. Higher light levels are not automatically better if the crop, temperature, CO₂ availability, or irrigation strategy cannot support them.
Step 3: Compare Fixture Photometric Data
Review each candidate fixture's photosynthetic photon flux (PPF), photosynthetic photon efficacy (PPE), electrical input, photon intensity distribution, spectral output, dimming compatibility, and thermal requirements.
Use independently tested photometric data where available. A fixture's PPF describes its total photon output, but the amount reaching a particular canopy depends on fixture optics, mounting height, spacing, obstructions, and light escaping the productive area.
Step 4: Model Fixture Spacing and Mounting Height
Use manufacturer photometric files or suitable lighting-design software to model fixture positions, mounting heights, overlap, and predicted canopy PPFD. Evaluate the average, minimum, maximum, and spatial variation across the productive canopy.
Compare alternative layouts rather than assuming that a specific fixture count or spacing will work in every room. Ceiling height, fixture dimensions, bench arrangement, and canopy geometry all influence the final design.
Step 5: Check Electrical and HVAC Capacity
Calculate the connected lighting load, expected operating load, circuit requirements, control infrastructure, and electrical distribution needs. Have a qualified electrical professional verify circuit sizing, overcurrent protection, grounding, and applicable code requirements.
Estimate the lighting-related heat load and coordinate it with HVAC and dehumidification design. The cooling system must handle the actual operating conditions, including equipment heat, plant transpiration, and moisture removal.
Step 6: Plan Controls and Maintenance Access
Specify dimming, scheduling, zoning, sensor placement, and control-system compatibility before installation. Provide enough clearance to clean fixtures, inspect connections, service drivers, and access electrical equipment safely.
Record the initial light map and operating settings so that future measurements can be compared against the commissioning baseline.
Step 7: Commission and Verify the Installed Layout
After installation, measure PPFD at canopy height using a calibrated quantum sensor. Take readings at consistent grid positions across the productive area and calculate the average, minimum, maximum, and uniformity statistics.
Compare measured results with the design model. Adjust fixture position, mounting height, aiming, or dimming as needed, then document the final configuration.
Design takeaway: A lighting plan is not complete when fixtures are installed. It is complete when measured canopy performance, electrical operation, and environmental control meet the facility's documented requirements.
Information Needed Before Designing a Grow Room Lighting Layout
Design input | What to document | Why it matters |
|---|---|---|
Room dimensions | Length, width, ceiling height, obstructions | Establishes layout constraints |
Productive canopy area | Bench dimensions and actual growing footprint | Prevents sizing from total floor area alone |
Crop requirements | Species, cultivar, growth stage | Determines suitable light targets |
PPFD and DLI targets | Target average, operating range, photoperiod | Defines required canopy light delivery |
Fixture specifications | PPF, PPE, spectral data, photometric file | Supports fixture comparison and modeling |
Mounting constraints | Fixture height, clearance, service access | Affects overlap, distribution, and maintenance |
Electrical capacity | Voltage, available circuits, connected load | Determines electrical feasibility |
Environmental conditions | Temperature, humidity, CO₂ strategy, transpiration | Informs lighting and HVAC coordination |
Controls | Dimming, scheduling, zoning, sensor compatibility | Supports repeatable operation |
Project economics | Electricity tariff, installation cost, incentives | Supports lifecycle cost analysis |
Use these inputs to compare layouts and fixture options before purchasing equipment. Final specifications should be validated against the actual room, local electrical requirements, crop needs, and verified fixture data.
Light Measurement Terms
PPFD (Photosynthetic Photon Flux Density)
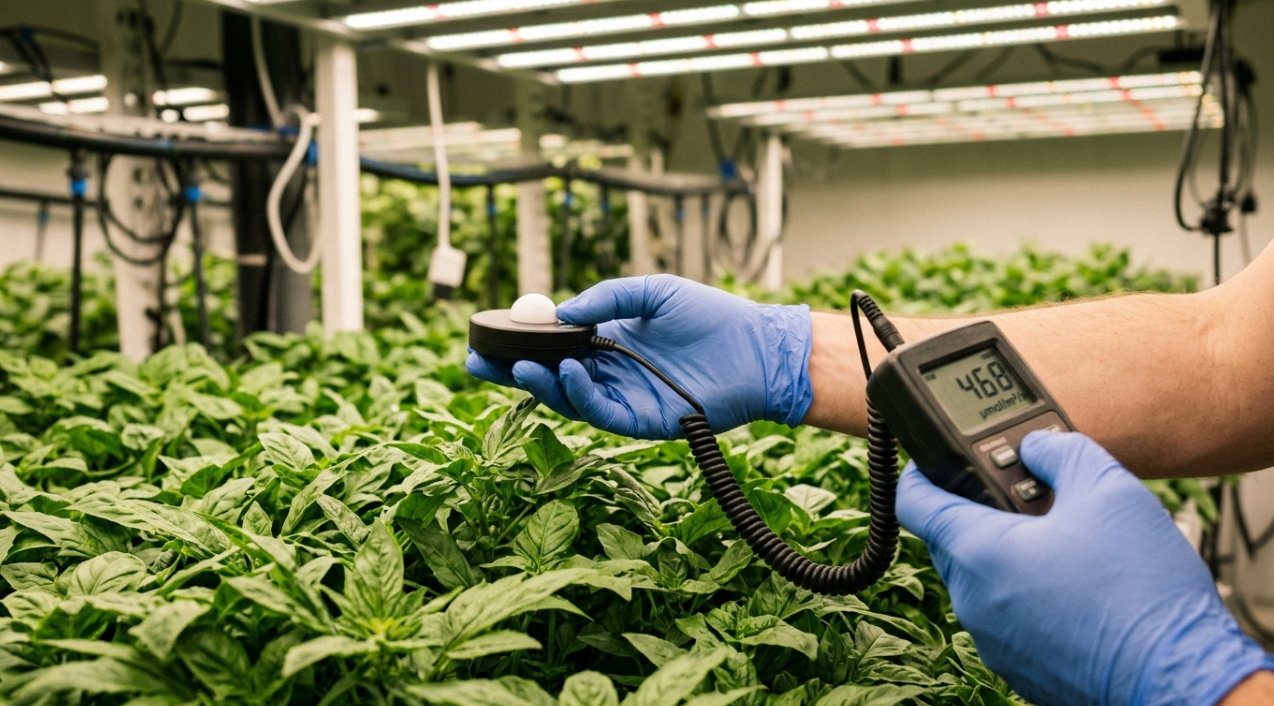
PPFD measures the instantaneous light intensity arriving at canopy level, expressed in µmol/m²/s (micromoles of photons per square meter per second). It is the single most important number in any lighting spec conversation.
What matters for commercial cultivation is the average canopy PPFD and how uniform that average is, not a single peak reading taken directly under the center of a fixture. Measuring at the fixture face instead of at canopy height dramatically overstates delivered PPFD.
Stage-by-stage PPFD targets:
Growth Stage | Target PPFD (µmol/m²/s) |
|---|---|
Seedlings & Clones | 100–300 |
Vegetative Growth | 300–600 |
Flowering (ambient CO₂) | 700–900 |
Flowering (CO₂ enriched) | 900–1,500 |
Hold the sensor cosine-corrected side up, at the height of your tallest plant. Take readings on a grid across the entire canopy, not just in the sweet spot. For detailed PPFD benchmarks by stage, see this cannabis PPFD guide.
DLI (Daily Light Integral)
Daily Light Integral (DLI) is the total number of photosynthetically active photons received per square meter over a 24-hour day. It is expressed in mol/m²/day and accounts for both light intensity and exposure duration.
For a constant or time-averaged PPFD over a fixed lighting period, calculate DLI using:
DLI = Average PPFD × Lighting hours × 0.0036
For example, a canopy receiving an average PPFD of 500 µmol/m²/s for 16 hours receives:
DLI = 500 × 16 × 0.0036 = 28.8 mol/m²/day
For changing natural or supplemental light, calculate DLI from time-series PPFD measurements or integrate the readings over time.
DLI helps compare lighting strategies with different intensities and photoperiods. However, an appropriate target depends on the crop, cultivar, growth stage, environmental conditions, and daily light schedule. Increasing DLI can also increase energy demand and cooling requirements. DLI correlates more directly with biomass accumulation than instantaneous PPFD does, making it the better planning metric for calculating light needs across an entire crop cycle.
PPF (Photosynthetic Photon Flux)
PPF is the total photon output of a fixture, measured in µmol/s. Think of it as raw horsepower before delivery losses. A fixture with high PPF but poor optics might waste much of that output on walls and aisles instead of canopy.
PPE / Efficacy (µmol/J)
When comparing fixtures, use verified PPE measurements alongside purchase price, expected operating hours, electrical costs, maintenance requirements, and useful service life. Modern horticultural LEDs can offer higher photon efficacy than HPS systems, but the financial case for replacing an existing installation depends on its current performance and the facility's operating conditions.
Treat exceptionally high efficacy claims cautiously. Ask for independent test documentation, the tested operating configuration, and the electrical input used to calculate PPE.
How to Compare Commercial Grow Room Lighting Fixtures
When evaluating commercial horticultural lighting fixtures, compare verified performance data under consistent conditions. Do not select equipment using wattage or efficacy alone.
Specification | What to check | Why it matters |
|---|---|---|
PPF (µmol/s) | Total photon output across the specified PAR range | Helps compare total fixture output |
PPE (µmol/J) | Photon output per joule of electrical input | Supports energy-efficiency comparisons |
Input power (W) | Actual rated and operating electrical draw | Helps determine electrical load and operating cost |
Photon distribution | Photometric file or intensity-distribution data | Supports layout modeling and overlap analysis |
Spectrum | Reported spectral power or quantum distribution | Helps assess suitability for the crop and production stage |
Dimming | Supported control protocol and operating range | Allows adjustment to target intensity |
Thermal design | Driver location, cooling method, and operating limits | Informs room heat-load and maintenance planning |
Safety certification | Applicable certification for the exact model | Supports code compliance and risk management |
Product qualification | Current listing and model-specific documentation | Helps verify claims and assess incentive eligibility |
Warranty and service | Warranty terms, replacement policy, and parts availability | Informs long-term operating risk |
Compare fixtures at the intended mounting height and layout. The highest-PPE fixture is not automatically the best option if its light distribution, compatibility, service requirements, or total installed cost is unsuitable for the facility.
PAR (Photosynthetically Active Radiation)
PAR is not a measurement but a wavelength range: 400–700 nm. This is the portion of the electromagnetic spectrum plants use for photosynthesis. When someone says “PAR light,” they mean photons within this band.
Spectrum
The spectral composition of your light affects plant morphology. More blue light (400–500 nm) keeps plants compact. More red light (600–700 nm) drives flowering and stem elongation. Far-red (700–750 nm) can accelerate flowering but also causes unwanted stretch if overdone. For a deeper look at how wavelengths shape growth, see this summary of light spectra impacts.
Uniformity and Layout Terms
Uniformity Ratio
Lighting uniformity describes how consistently PPFD is distributed across the productive canopy. The formula must be stated explicitly because different uniformity metrics produce different results.
A simple minimum-to-maximum ratio is calculated as:
Minimum-to-maximum uniformity ratio = Minimum PPFD ÷ Maximum PPFD
For example, if the minimum PPFD is 700 µmol/m²/s and the maximum is 900 µmol/m²/s, the ratio is 0.78, or 78%.
Another commonly used measure is the minimum-to-average ratio:
Minimum-to-average ratio = Minimum PPFD ÷ Average PPFD
These metrics are not interchangeable. When comparing lighting layouts, state which formula is being used and report the average, minimum, and maximum PPFD values alongside it.
A more uniform layout can reduce differences in light exposure across the crop, but acceptable uniformity depends on the crop, growing system, measurement grid, and production requirements. Establish a project-specific target and verify it using canopy-level measurements. For a full walkthrough of measuring and improving uniformity, see this canopy uniformity guide.
Coefficient of Variation (CV)
CV expresses the statistical spread of PPFD readings across your canopy as a percentage. Industry consensus puts a CV at or below 15% as the practical threshold for uniform canopy development. Lower is better.
Canopy Mapping / PPFD Grid
Accurate canopy mapping is the first step in any efficient commercial grow room lighting design. Map the productive canopy area, not the total room footprint. Aisles, equipment zones, HVAC units, and structural columns consume floor space without producing crop. Designing for active canopy area rather than total room dimensions prevents overlighting non-crop spaces and wasting photons on concrete.
Take PPFD readings on a grid (typically 1-foot spacing) at canopy height, then plot them to visualize your light distribution. This map reveals dead zones and hotspots that fixture repositioning or height adjustments can fix.
Fixture Overlap
Uniformity usually improves when fixtures overlap at their edges in a controlled way. This overlap softens the transition between adjacent light zones, reducing sharp drops in photon density. Too much overlap wastes energy; too little creates gaps. Photometric software from fixture manufacturers can model overlap before you hang a single light.
Canopy Mapping and PPFD Grid Measurements
Canopy mapping measures how photosynthetic photon flux density (PPFD) varies across the productive growing area. It helps verify a lighting model, identify poorly illuminated zones, and document performance after installation.
How to Measure Canopy PPFD
Define the measurement area. Mark the productive canopy boundaries and exclude walkways or other non-growing areas from the canopy statistics.
Set a consistent measurement height. Position the sensor at the intended canopy plane and record that height for future comparisons.
Choose a repeatable grid. Use evenly distributed measurement points, with closer spacing where the light pattern changes rapidly or where edges and obstructions affect coverage.
Use an appropriate sensor. Use a suitable quantum sensor and follow its calibration, orientation, and measurement instructions.
Record operating conditions. Document fixture output, dimming settings, mounting height, lighting schedule, and other conditions that could affect the readings.
Calculate summary statistics. Report average, minimum, maximum, and the selected uniformity metric. Calculate coefficient of variation if you need to quantify relative spatial variability.
Compare results with the design model. Investigate unexpected differences and adjust fixture positioning, height, or output where appropriate.
Repeat the measurements after significant layout changes and during scheduled performance checks. Use consistent grid locations and operating conditions so that changes over time can be interpreted accurately.
A PPFD map should include the measurement plane, grid spacing, sensor details, fixture settings, and the formula used for any uniformity statistic. Without those details, results from different rooms or test sessions may not be directly comparable.
Fixture and Form Factor Terms
Bar-Style LED Fixtures
Bar-style fixtures distribute diodes across multiple parallel bars rather than concentrating them in a single panel. This spread reduces hotspots and improves uniformity across the canopy. Bar-style is now the dominant form factor in commercial cannabis cultivation because the distributed layout delivers more even PPFD maps, runs cooler, and fits cleanly into standard ceiling grid configurations.
Mounting Height
The distance between your fixture and the canopy top is one of the most consequential variables in commercial grow room lighting design. Mounting lights higher increases overlap between adjacent fixtures, reducing hotspots and filling in gaps. The trade-off is a slight reduction in peak intensity, but that trade-off frequently increases total yield because uniformity improves.
Start with the manufacturer’s recommended mounting height, verify with a PPFD grid, and adjust from there. Most facilities find their sweet spot within a 6- to 12-inch range of the recommended height. Our LED light distance guide covers this optimization process step by step.
Full-Spectrum White Light
Full-spectrum white fixtures emit a broad, continuous spectrum that mimics daylight, typically using phosphor-converted LEDs. Compared to red/blue “pink” or “blurple” fixtures, full-spectrum white produces a more natural working environment for employees and delivers a balanced photon mix that supports healthy growth across all stages. Thrive’s patented phosphor chemistry is engineered specifically to produce this kind of broad-spectrum output.
Under-Canopy Lighting
Low-wattage LED bars placed beneath the plant canopy, pointing upward to illuminate lower leaves and bud sites that overhead lights miss. This approach adds light where the plant needs it most, rather than simply adding more power from above. Thrive’s patent-pending under-canopy configuration has shown yield gains up to 20–30%.
Learn more about under-canopy lighting and how it fits into a full facility design.
Electrical Infrastructure Terms
LED Driver
The driver converts AC mains power to the regulated DC current LED diodes require. Constant current drivers ensure each LED receives exactly the current it is designed for, maintaining consistent light output, stable color spectrum, and preventing thermal runaway. Drivers are typically the first component to fail in an LED fixture, especially in warm, humid environments where capacitors degrade faster.
Centralized / Remote Power Architecture
This is the emerging design paradigm that addresses the biggest pain points in grow room lighting electrical design: GFCI complexity, driver failures, heat load, and installation cost. In a centralized architecture, LED drivers are removed from individual fixtures and relocated to a centralized rack, typically outside the grow space. The rack converts AC power and distributes DC or regulated low-voltage power to lightweight, driverless fixtures on the ceiling.
The benefits are substantial. Heat generated by drivers is easier to manage in a dry electrical room than in a warm, humid grow environment. Drivers with active electrical components like capacitors are more prone to failure in humid conditions, so relocating them improves reliability. Centralizing a few large drivers also simplifies servicing compared to managing hundreds or thousands of individual drivers dispersed across the facility. Since drivers are not washable, removing them from grow spaces reduces biosecurity risks too.
Thrive’s OptiDrive platform (available in DC and DE configurations) is purpose-built for this approach, delivering up to 12,000 watts per shelf at up to 95% efficiency while removing hundreds of potential failure points from the grow room.
Voltage Drop
The reduction in voltage as current travels through wiring. In large facilities with long cable runs, fixtures at the far end of the circuit can receive less power than those near the panel, causing dimmer output and uneven PPFD. Proper wire sizing and circuit planning prevent this.
Dedicated Circuits / Electrical Loading
Use dedicated circuits for high-power equipment such as lights and HVAC systems to prevent overloading. In commercial grow room lighting design, this is not optional. Sharing circuits between lighting and other equipment risks tripped breakers during critical photoperiods.
GFCI (Ground Fault Circuit Interrupter)
Centralized power architecture relocates some or all LED driver equipment away from individual fixtures, potentially simplifying maintenance and moving driver heat out of the cultivation room. Its effect on wiring, protection devices, installation costs, and reliability depends on the system design and operating environment.
GFCI requirements must be determined from the applicable electrical code, equipment instructions, circuit configuration, and installation conditions. A centralized power system does not automatically eliminate the need for GFCI protection or guarantee compliance. Have a qualified electrical professional review the complete installation before specifying the architecture.
Environmental Integration Terms
Heat Load / BTU Calculation
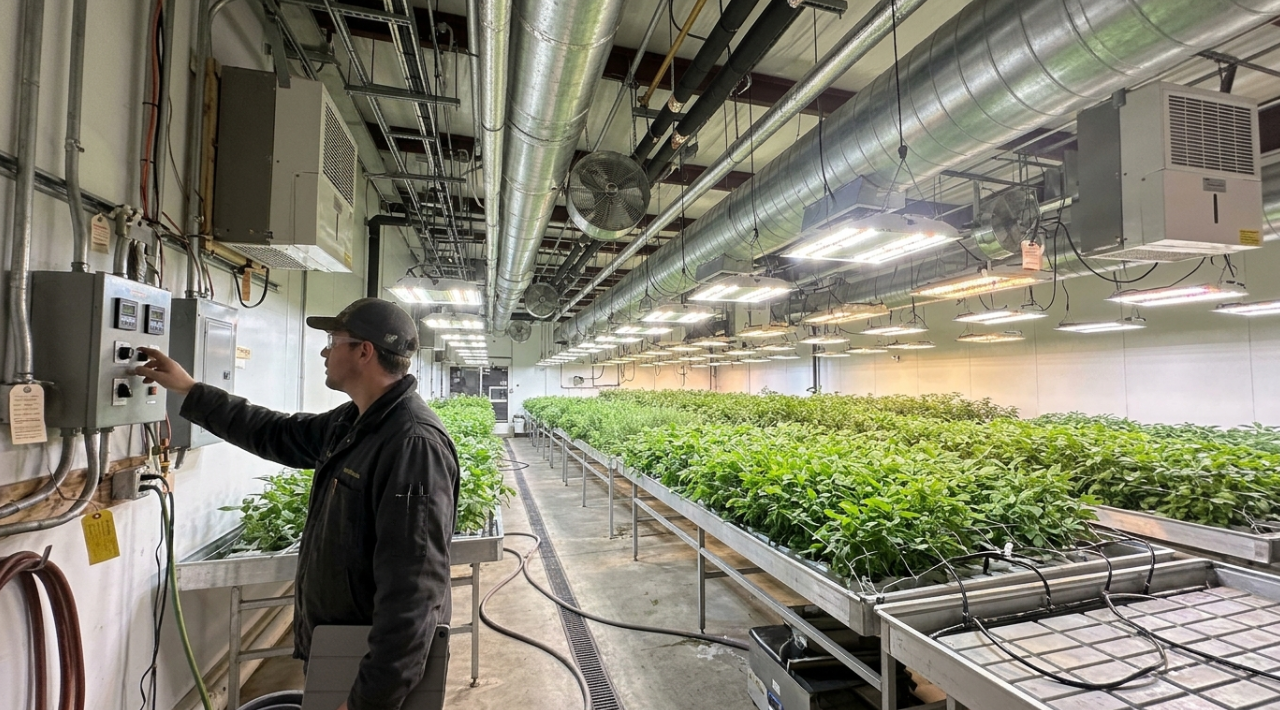
Electrical power is an important input when estimating the heat load associated with grow room lighting. As a planning conversion, 1 watt of electrical power corresponds to approximately 3.412 BTU/hr when the consumed energy ultimately becomes heat within the space being assessed.
For example, a 600W fixture corresponds to approximately 2,047 BTU/hr of heat-equivalent load if all 600W is released as heat within the grow room. If drivers or other power equipment are located outside that room, their heat contribution must be evaluated separately.
Actual HVAC sizing requires more than multiplying fixture wattage by 3.412. Account for other equipment, envelope heat gains, outdoor conditions, plant transpiration, moisture removal, air distribution, and the operating schedule.
Higher-efficacy lighting can reduce electrical consumption for a given photon output. It can also reduce the heat that must be removed from the space, depending on fixture design and where the electrical losses occur. Quantify the total facility savings using the actual lighting and HVAC configurations rather than assuming a fixed additional saving for every watt avoided. For a detailed breakdown, see how much HVAC you need to cool your lights.
Sensible vs. Latent Heat
Sensible heat causes a temperature change you can measure with a thermometer. Latent heat involves moisture changes (evaporation and condensation) without a temperature shift. Both matter for HVAC sizing in grow rooms because plants transpire heavily under intense light, adding moisture that the dehumidification system must remove. Understanding the distinction between latent and sensible heat prevents undersizing your climate system.
VPD (Vapor Pressure Deficit)
VPD is the difference between the moisture air currently holds and the maximum it could hold at saturation. Lighting directly affects VPD because it raises leaf temperature, which changes the vapor pressure at the leaf surface. Getting VPD wrong limits transpiration and nutrient uptake regardless of how perfect your light levels are.
Light Depreciation and Fixture Maintenance
LED output degrades over time, and residue buildup on lenses accelerates the process. One industry report documented an 11% drop in light output over just six months from unnoticed lens contamination. Regular lens cleaning and periodic PPFD verification should be part of every maintenance schedule.
Certification and Economics Terms
DLC (DesignLights Consortium) Certification
The DesignLights Consortium (DLC) maintains technical requirements and a Qualified Products List (QPL) for eligible horticultural LED lighting products. Its Horticultural Technical Requirements V4.0 took effect on April 18, 2025, and establishes a minimum photosynthetic photon efficacy (PPE) threshold of 2.5 µmol/J for covered LED horticultural lighting products.
Meeting the PPE threshold alone does not establish that a fixture is DLC-listed or guarantee eligibility for an incentive. Qualification also depends on the applicable technical requirements, product testing, documentation, and safety certification.
Before specifying fixtures for a retrofit, verify the exact model on the DLC horticultural lighting resources page. Then confirm the current requirements of the relevant utility or incentive program.
Important: DLC listing and utility rebate eligibility are related but separate checks. A listed product does not guarantee that a particular project will receive a rebate.
Utility Rebates
Rebate values range from $50 to $200 per fixture, with some programs covering 50–100% of the upfront fixture cost for qualifying retrofits. Cannabis-specific incentive tiers in states like Massachusetts, Illinois, and Colorado tend to sit at the higher end because utilities target the heaviest commercial electrical loads first.
A facility replacing 50 HPS fixtures with DLC-certified LED grow lights might recover $15,000–$40,000 depending on the wattage difference and utility program. Check your rebate eligibility before specifying fixtures, not after.
UL Listing
Safety certification from Underwriters Laboratories confirming that a fixture meets published safety standards for electrical and fire risk. UL listing (along with CE and CSA certifications) is a standard inclusion across Thrive’s fixture lineup and is typically required by building inspectors and insurance underwriters.
Multi-Room Zoning and Control Terms
Light Zoning
Different growth stages need different light levels. A well-planned facility zones its rooms accordingly:
Zone | PPFD Target (µmol/m²/s) |
|---|---|
Propagation / Clone | 150–300 |
Vegetative | 400–600 |
Flower (ambient CO₂) | 700–900 |
Flower (CO₂ enriched) | 900–1,500+ |
DLI accounts for both intensity and photoperiod, and it correlates more directly with biomass accumulation. Design each zone’s lighting around a DLI target, not just a PPFD number.
Photoperiod
The daily light/dark cycle. Cannabis veg typically runs 18 hours on and 6 off. Flower runs 12/12. Photoperiod directly determines DLI at any given PPFD, so changing your schedule without adjusting intensity (or vice versa) shifts your DLI and affects growth.
Dimming / 0–10V Control
Most commercial LED fixtures accept 0–10V dimming signals. After optimizing mounting height for uniformity, use the dimmer to dial intensity to target PPFD without changing the distribution profile. This is the correct order of operations: height first (for uniformity), then dimming (for intensity).
The “Watts Per Square Foot” Problem
Watts per square foot was a useful shorthand in the HPS era because most HPS fixtures had similar efficacy. LEDs severed that link completely. A 35-watt-per-square-foot room using fixtures at 1.8 µmol/J delivers about 230 µmol/m²/s average PPFD. The same wattage with a 3.2 µmol/J LED pushes past 400 µmol/m²/s. Same power draw. Completely different DLI.
Output is a function of efficacy, not draw. If a vendor or consultant sizes your room in watts per square foot without specifying the efficacy of the fixtures, push back. In 2026, this metric belongs in the past.
Spectral Uniformity
Most growers think about intensity uniformity. Fewer think about spectral uniformity, and that blind spot costs them. Research demonstrates that uneven distribution of specific wavebands across the canopy, not just total PPFD, drives differences in biomass and crop quality. A facility where blue and red ratios shift from one bench position to another will see cultivar-specific growth responses, even if the total PPFD map looks perfectly uniform. Full-spectrum white fixtures with broad, consistent spectral output reduce this risk compared to fixtures that blend discrete red and blue diodes.
Common Mistakes in Commercial Grow Room Lighting Design
1. Designing for total floor area, not canopy area. Aisles, equipment zones, and structural columns consume floor space without producing crop. Design for active canopy area to avoid wasting photons on concrete.
2. Chasing peak PPFD instead of uniformity. A layout that hits peak PPFD in the center but drops 30% at the edges fails on uniformity. That failure shows up as uneven grading and reduced marketable yield.
3. Relying on wattage as a sizing metric. As covered above, wattage tells you nothing about light output without knowing fixture efficacy.
4. Trusting manufacturer PPFD specs without verification. Independent testing has repeatedly shown that manufacturers report average PPFD values 10–50% higher than third-party measurements at the same distances. Verify before you buy.
5. Ignoring the lighting-HVAC nexus. Before you raise any PPFD target for a CO₂-enriched room, confirm your HVAC can absorb the added thermal load. More light always means more heat.
6. Skipping rebate applications. With fewer than half of eligible growers claiming available utility rebates, thousands of dollars routinely go unclaimed. File before installation, not after, because most programs require pre-approval.
Quick-Reference Commercial Grow Room Lighting Benchmarks
Metric | Reference value or rule | Important qualification |
|---|---|---|
PPFD | Measured in µmol/m²/s | Target depends on crop and growth stage |
DLI | Measured in mol/m²/day | Depends on PPFD, photoperiod, and other daily light exposure |
DLI conversion | PPFD × lighting hours × 0.0036 | For constant or time-averaged PPFD over the stated period |
PPF | Measured in µmol/s | Describes total fixture photon output |
PPE | Measured in µmol/J | Compare using consistent test methods and operating conditions |
DLC Hort V4.0 PPE threshold | At least 2.5 µmol/J | Does not alone guarantee product listing or a utility rebate |
Minimum-to-maximum uniformity ratio | Minimum PPFD ÷ maximum PPFD | State the formula and measurement grid |
Coefficient of variation | Standard deviation ÷ average PPFD × 100% | Lower values indicate less relative spatial variation |
Heat-equivalent conversion | Approximately 3.412 BTU/hr per watt | Apply to energy ultimately released as heat within the assessed space |
Fixture spacing and height | Determined by photometric modeling and field measurements | No universal spacing works for every room |
Rebate amount | Confirm with the current utility program | Eligibility and incentive levels vary by location and project |
Use crop-specific light recommendations and the selected fixture's verified performance data when specifying a real facility. Treat numerical targets as design inputs to validate, not as substitutes for photometric modeling and commissioning.
Frequently Asked Questions
What is the most important metric in commercial grow room lighting design?
DLI (Daily Light Integral) is the most consequential planning metric because it accounts for both light intensity and photoperiod duration. PPFD gets more attention in sales conversations, but DLI correlates more directly with biomass accumulation and crop quality across a full cycle.
How do I know if my lighting layout has good uniformity?
Take PPFD readings on a 1-foot grid at canopy height across the entire grow area. Calculate the ratio of the minimum reading to the average reading. A ratio above 0.75 is acceptable; above 0.85 is excellent. If your CV exceeds 15%, you have uniformity problems that will show up in inconsistent grading.
Is watts per square foot still a useful metric?
No. LEDs have completely decoupled wattage from output. A room drawing 35 watts per square foot could deliver anywhere from 230 to 400+ µmol/m²/s depending on fixture efficacy. Always specify your design in PPFD and DLI, not watts.
How much heat does grow room lighting produce?
Every watt of lighting generates 3.41 BTU/hr. Lighting typically accounts for 70–85% of a grow room’s total heat load. For every watt you save through higher-efficacy fixtures, you also reduce the HVAC energy needed to remove that heat.
What PPE should I look for in a commercial LED fixture in 2026?
The commercial range is 2.6 to 3.6 µmol/J. The DLC V4.0 minimum threshold for rebate eligibility is 2.5 µmol/J. Anything below 2.0 µmol/J is obsolete. Anything claiming well above 3.6 µmol/J should come with an independent test report.
What is centralized power architecture, and why does it matter?
Centralized power removes LED drivers from individual fixtures and relocates them to a rack outside the grow space. This reduces in-room heat, improves driver reliability (by keeping them out of humid environments), simplifies GFCI compliance, and lowers installation costs. It also removes potential failure points from the grow area.
How much can utility rebates offset the cost of a lighting upgrade?
Rebates typically range from $50 to $200 per fixture. A 50-fixture HPS-to-LED retrofit could recover $15,000 to $40,000 depending on the wattage difference and your utility’s program. Cannabis-specific programs in states like Massachusetts, Illinois, and Colorado tend to offer higher incentives.
Should I design lighting for total room square footage or canopy area?
Always design for active canopy area. Aisles, equipment zones, and structural columns do not produce crop. Designing for total floor area wastes energy and capital on lighting spaces that will never hold plants.
How Many LED Grow Lights Does a Commercial Grow Room Need?
The number of fixtures depends on the productive canopy area, target PPFD, fixture photon output, light distribution, mounting height, and desired uniformity. Use fixture photometric files to model alternative layouts, then verify the installed system with canopy-level PPFD measurements. Room area and fixture wattage alone are not enough to determine the correct quantity.
What Information Should a Grow Light Photometric Plan Include?
A useful photometric plan includes room dimensions, productive canopy boundaries, fixture model and positions, mounting height, predicted PPFD distribution, average and minimum PPFD, the selected uniformity metric, and relevant operating assumptions. Include electrical load and control requirements in the broader project specification.
How Often Should Commercial Grow Room Lighting Be Measured?
Measure PPFD during commissioning, after major lighting or canopy-layout changes, and periodically according to the facility's maintenance schedule. Compare results using consistent sensor placement, grid locations, and fixture settings. Inspection frequency should reflect operating conditions, contamination risk, crop sensitivity, and the consequences of light-output changes.
Does a Higher-Efficacy LED Always Reduce Total Facility Costs?
Not automatically. Higher photon efficacy can reduce the electricity required to produce a given quantity of photons, but total savings depend on the lighting layout, operating hours, electricity rates, HVAC performance, installation costs, maintenance, and crop response. Compare the total installed and operating cost of each viable design rather than using efficacy as the sole purchasing criterion.
Can a Commercial Grow Room Use the Same PPFD Target for Every Crop?
No. Suitable PPFD depends on crop species, cultivar, growth stage, photoperiod, environmental conditions, and production objectives. Select crop-specific targets and validate them against actual plant performance. A target suitable for one crop or production stage may be inappropriate for another.
What Is the Difference Between a Lighting Design Model and Commissioning?
A lighting design model predicts how fixtures are expected to distribute light based on fixture data and room geometry. Commissioning checks the installed system through measurements and operational tests. Commissioning can reveal differences caused by installation, fixture positioning, control settings, obstructions, or incorrect design assumptions.
Ready to apply these concepts to your facility? Schedule a consultation with a lighting specialist to get a photometric layout matched to your room dimensions, crop targets, and budget.