Cannabis LED Lighting Layout: 2026 Guide + Glossary
Plan a Cannabis LED Lighting Layout that hits PPFD/DLI targets with 0.75+ uniformity. Get stage ranges, spacing, height, and under-canopy tips.
TL;DR
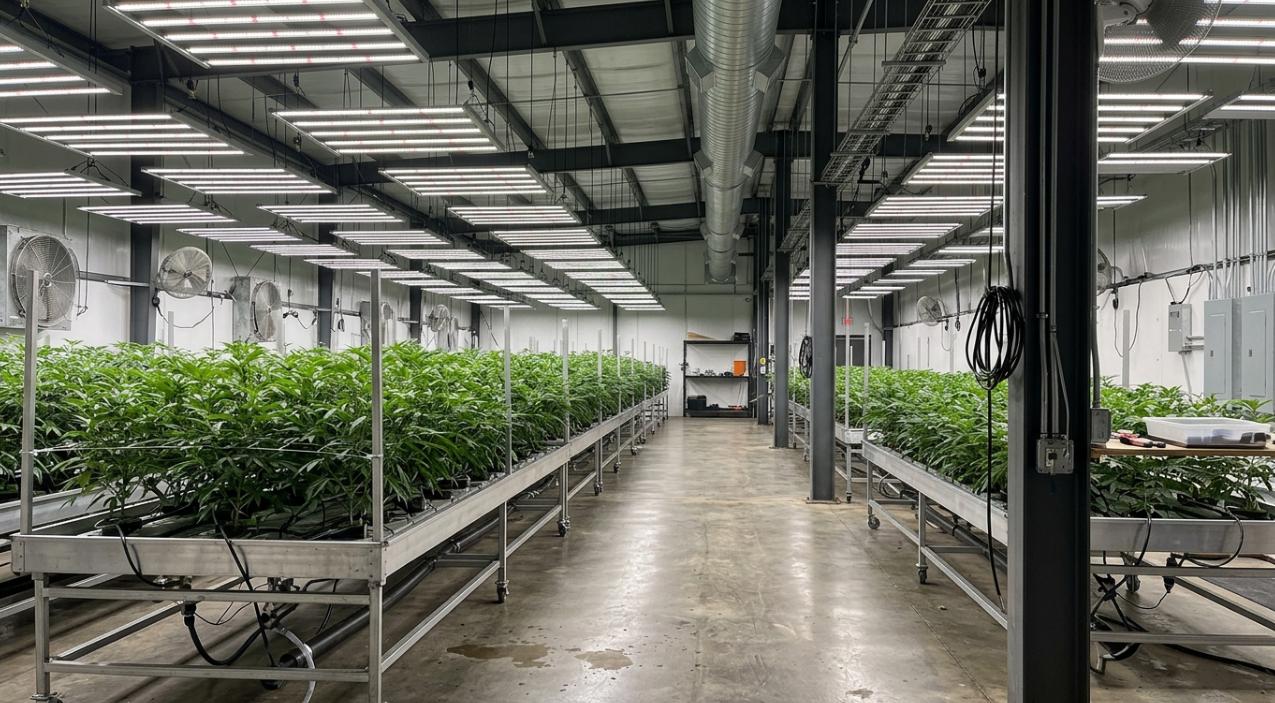
A cannabis LED lighting layout is the planned arrangement of fixtures, their spacing, mounting height, and orientation, all designed to deliver target PPFD and DLI evenly across every square foot of canopy. Uniformity matters more than peak intensity. A room averaging 800 µmol/m²/s with tight uniformity will outperform one averaging 900 with hot centers and cold edges. This guide defines every metric that governs layout decisions, provides stage-by-stage PPFD targets, and walks through the verification methods commercial growers use to confirm their layouts actually work.
What Is a Cannabis LED Lighting Layout?
A cannabis LED lighting layout is the blueprint for how fixtures are positioned within a grow room or greenhouse. It covers fixture count, row orientation, spacing between units, mounting height above the canopy, and whether supplemental lighting (like under-canopy bars) is part of the plan. The goal is straightforward: deliver the right amount of photosynthetically active light, distributed evenly, to every plant in the room.
Layout is the highest-leverage decision a grower makes after choosing LED. The same fixtures arranged poorly can waste 20 to 30% of their potential. A layout that hits peak PPFD in the center but drops 30% at the edges produces uneven growth, inconsistent grading, and reduced marketable yield. Arranged well, those identical fixtures produce uniform, grade-consistent harvests cycle after cycle.
This distinction matters because most growers spend weeks comparing fixture specs but only hours planning where those fixtures actually go. Fixture selection is important. But the layout determines whether that selection pays off.
Cannabis LED Lighting Layout: Quick Answer
A cannabis LED lighting layout is a plan for positioning grow lights to deliver the required photosynthetic photon flux density (PPFD) and daily light integral (DLI) evenly across the plant canopy. An effective layout accounts for room dimensions, fixture output, mounting height, spacing, canopy size, and growth stage.
To plan a layout, measure the growing area, establish stage-appropriate light targets, review each fixture's PPFD distribution map, estimate fixture quantity, and verify coverage with a canopy-level light meter after installation. Prioritize consistent light distribution over peak intensity, and adjust fixture spacing, mounting height, and dimming according to measured results.
Explore commercial cannabis lighting solutions to see how fixture choice and layout design work together.
Light Measurement Terms Every Layout Depends On
Before you can plan fixture spacing or mounting height, you need to understand the metrics that define what “good light” means for cannabis. These terms build on each other, so they’re presented in a logical sequence from broadest to most specific.
PAR (Photosynthetically Active Radiation)
PAR refers to the 400 to 700 nm wavelength range that plants use for photosynthesis. It defines what counts as “useful light” for cannabis. Not all light a fixture emits falls within this range, so PAR is the starting point for evaluating any grow light’s relevance to plant growth.
Why it matters for your layout: Every metric that follows, PPF, PPFD, DLI, is measured within the PAR range. If a fixture produces a lot of lumens but little PAR, it’s useless for growing. For a deeper breakdown of how PAR relates to PPFD, see this PAR vs. PPFD guide.
PPF (Photosynthetic Photon Flux)
PPF measures the total number of photons a fixture emits per second within the PAR range. It’s expressed in µmol/s. Think of it as the fixture’s total light output, independent of where those photons land.
Why it matters for your layout: PPF tells you how much light a fixture produces in total. But it says nothing about how that light is distributed. Two fixtures with identical PPF can have very different beam patterns, which means very different layouts.
PPFD (Photosynthetic Photon Flux Density)
PPFD measures how many photons actually land on a given square meter per second, expressed in µmol/m²/s. This is the metric that directly connects to plant growth because it describes what the canopy actually receives.
Here’s the critical point most spec sheets obscure: PPFD is a local measurement. The center beneath a fixture may receive 900 while the corners receive only 450. A single impressive center reading does not prove good coverage. Average canopy-level PPFD and the uniformity between center and edges matter far more than any single-point number.
Why it matters for your layout: PPFD is the number that dictates how far apart your fixtures go, how high you mount them, and how many you need. It’s the sizing metric that actually matters for cannabis LED lighting layout design.
DLI (Daily Light Integral)
DLI is the total photon dose a plant receives over a full 24-hour period, measured in mol/m²/day. While PPFD is instantaneous, DLI accounts for how long the lights run.
The formula is simple:
DLI = PPFD × 3.6 × Hours per Day ÷ 1,000
So a plant receiving 800 µmol/m²/s for 12 hours gets a DLI of about 34.6 mol/m²/day. For a complete walkthrough of this calculation with worked examples, see this DLI formula and conversion guide.
Why it matters for your layout: DLI is how you reconcile PPFD with photoperiod. A flowering plant on 12 hours needs higher PPFD to hit the same DLI as a vegging plant on 18 hours. Your cannabis LED lighting layout must account for this.
PPE (Photosynthetic Photon Efficacy)
PPE measures how efficiently a fixture converts electricity into usable plant light, expressed in µmol/J. Higher is better. Modern commercial LEDs target 2.5 to 3.0+ µmol/J.
Why it matters for your layout: A more efficient fixture produces more photons per watt. That means fewer fixtures (or lower wattage) to hit the same PPFD targets, which changes your layout geometry and your electrical load.
Uniformity Ratio
Uniformity ratio is calculated as minimum PPFD divided by average (or maximum) PPFD across the canopy. The target should be 0.75 or higher for most cannabis setups. Below 0.70, edge plants underperform significantly relative to center plants. Some commercial operations push for 0.85 or above.
Why it matters for your layout: This is arguably the single most important number for a cannabis LED lighting layout. A room averaging 800 PPFD with a 0.85 uniformity ratio will produce more consistent, higher-grade flower than a room averaging 900 PPFD with a 0.65 ratio. Uniformity is the operational number. Peak PPFD is the marketing number.
CRI (Color Rendering Index)
CRI measures how accurately a light source renders colors compared to natural sunlight, on a scale of 0 to 100. It’s a human-centric metric, not a plant-centric one.
Why it matters for your layout: High-CRI fixtures (above 80) let cultivation staff accurately assess plant health, spot deficiencies, and detect pests without switching to separate inspection lights. In a commercial operation, that saves time and catches problems earlier.
DLC (DesignLights Consortium)
DLC is a third-party certification that validates a fixture meets minimum efficacy, quality, and reporting standards. Fixtures on the DLC Qualified Products List are eligible for utility rebates in many jurisdictions.
Why it matters for your layout: DLC-listed fixtures can unlock rebates that significantly reduce project cost. If your cannabis LED lighting layout uses 100+ fixtures, rebate eligibility affects your total capital outlay. Check current rebate programs before finalizing your fixture count.
PPFD and DLI Targets by Cannabis Growth Stage
PPFD measures instantaneous light intensity at canopy level, while DLI measures the total amount of photosynthetically active light received over a day. The appropriate target depends on the growth stage, cultivar, photoperiod, CO₂ availability, temperature, and other environmental conditions.
The following ranges are illustrative starting points for planning a cannabis LED lighting layout, not universal prescriptions.
Growth stage | Illustrative PPFD range (µmol/m²/s) | Example photoperiod | Approximate DLI (mol/m²/day) |
|---|---|---|---|
Seedling or clone | 100–300 | 18 hours | 6.5–19.4 |
Vegetative | 400–600 | 18 hours | 25.9–38.9 |
Early flowering | 600–800 | 12 hours | 25.9–34.6 |
Peak flowering | 800–1,000 | 12 hours | 34.6–43.2 |
Flowering under elevated CO₂ | 900–1,200 | 12 hours | 38.9–51.8 |
How to use these values: Select an initial target based on your cultivation conditions, then use fixture distribution data and canopy-level PPFD measurements to determine whether the layout delivers that target consistently.
Higher PPFD does not automatically translate into higher yield. Increasing light intensity may require adjustments to CO₂ availability, temperature, irrigation, nutrition, and other environmental variables. Elevated CO₂ does not guarantee that a plant can benefit from higher intensity, and there is no single PPFD threshold that applies to every cultivar or facility.
Before increasing intensity, confirm that the current canopy is using the available light effectively and that environmental conditions can support the change.
Fixture and Layout Terms
Mounting Height
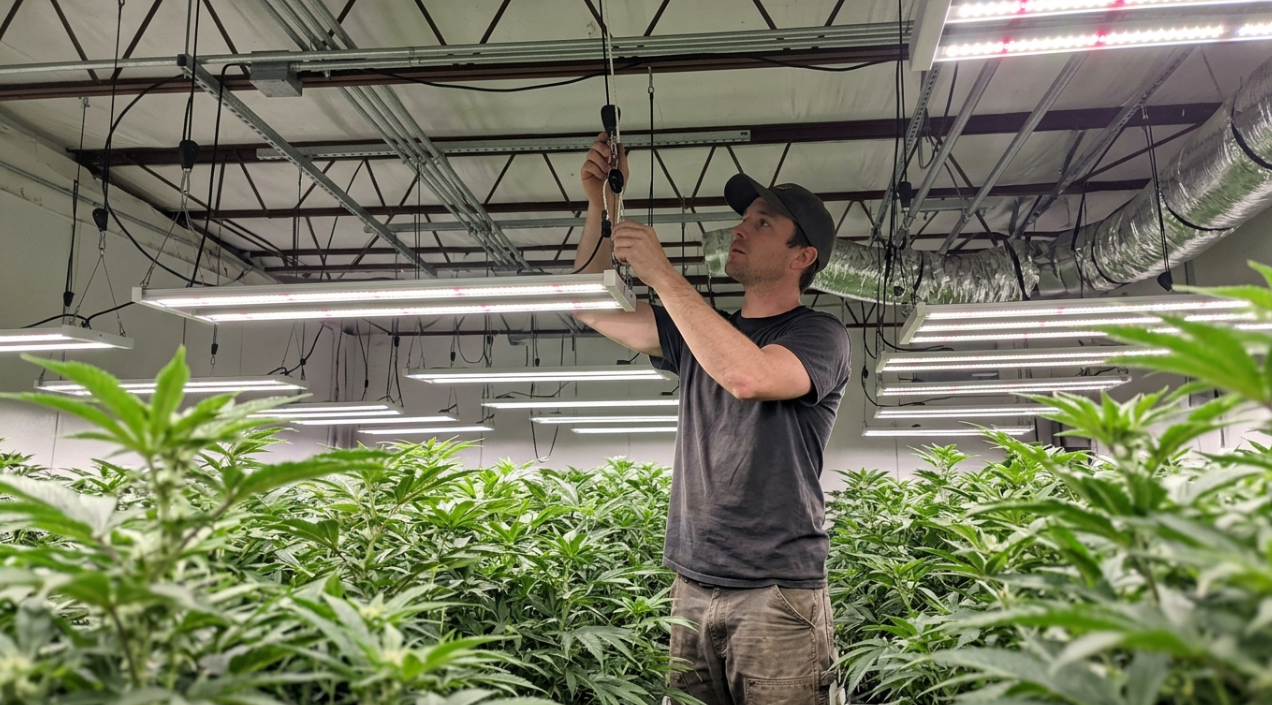
Mounting height is the distance between the fixture and the top of the canopy. General guidelines call for 24 to 30 inches above seedlings and 12 to 24 inches above mature plants, but these ranges shift significantly with fixture wattage. A 200W fixture might sit 20 inches above the canopy during flower, while a 1,000W fixture needs 21 to 36 inches.
The key principle: if you mount LEDs too close, you create intense hotspots under each bar or panel. Raising fixtures generally reduces hotspot intensity and improves uniformity, which often increases whole-canopy yield even if the peak PPFD number goes down. One practitioner on a commercial growing forum shared that raising fixtures 8 inches, which dropped peak output by about 5%, improved yield uniformity from 72% to 89%. The trade-off was clearly worth it.
Uniform light also helps keep EC and irrigation strategies simpler because plants across the room transpire more similarly when they receive similar light levels.
Fixture Footprint and Overlap
Every fixture has a footprint, the area it effectively illuminates at a given height. Where adjacent fixtures’ footprints meet, their light overlaps. In most commercial cannabis LED lighting layouts, a 10 to 20% overlap between adjacent fixtures produces the smoothest canopy-level PPFD distribution.
Too little overlap creates dark bands between fixtures. Too much wastes electricity by stacking photons beyond what the canopy can use.
Bar-Style vs. Panel Fixtures
This is one of the most consequential layout decisions. Bar-style fixtures distribute photons over a wider linear area and tolerate closer spacing without creating hotspots. Their elongated footprint produces smoother light fields than square panel fixtures at equivalent spacing. For commercial flower rooms, bar fixtures are the preferred choice because they cover rectangular bench and row geometries naturally.
Panel fixtures concentrate output in a smaller footprint. You need more of them, spaced more carefully, to achieve the same uniformity. They can still work well in smaller rooms or tent setups, but for any room over a few hundred square feet, bar-style fixtures simplify layout planning considerably.
The “Higher and Wider” Principle
This is the practical takeaway from everything above. Mount fixtures higher than your instinct suggests and space them wider to allow proper overlap. The result is a more uniform light field with fewer hot and cold zones. Fine-tune intensity with dimming, not height.
Most commercial LED fixtures accept 0 to 10V dimming signals. After optimizing height for spread, use the dimmer to dial intensity to your target PPFD without changing the uniformity pattern. This is operational knowledge that separates experienced growers from beginners.
See the Pinnacle series for an example of how bar-style fixtures with dimming integrate into commercial flower room layouts.
Watts Per Square Foot
Many growers target roughly 30 to 50 watts of actual draw per square foot of canopy during flowering at standard CO₂ levels. Higher-efficiency fixtures can hit the same PPFD at the lower end of that range. Vegetative stages can sustain healthy growth at about 20 to 30W per square foot.
But here’s the caveat that matters: wattage alone shouldn’t dictate your coverage area or determine the effectiveness of an LED grow light. Two fixtures drawing the same watts can produce very different PPFD maps depending on their optics, bar count, and efficacy. PPFD is the sizing metric. Watts per square foot is a rough sanity check.
Cannabis LED Lighting Layout: Key Design Variables Compared
Design variable | What it affects | What to check |
|---|---|---|
Fixture count | Total photon output and coverage | PPF, usable canopy area, and simulated PPFD |
Mounting height | Footprint, intensity, and overlap | Manufacturer distribution maps and measured PPFD |
Fixture spacing | Gaps, overlap, and light uniformity | Edge readings, minimum PPFD, and average PPFD |
Fixture orientation | Coverage across benches and rows | Room dimensions, aisle positions, and bench layout |
Dimming | Overall light output and energy demand | Measured PPFD at the intended operating level |
Fixture efficacy | Electricity required for a given photon output | PPE in µmol/J and actual input power |
Under-canopy lighting | Light reaching lower plant layers | Lower-canopy light measurements and incremental energy use |
Wall reflectance | Light distribution near room boundaries | Surface condition and edge PPFD measurements |
Electrical design | Circuit capacity, controls, and installation safety | Qualified electrical design and manufacturer requirements |
Design principle: Evaluate these variables together. Changing one may affect several others, so a layout should be checked as a complete system rather than optimized using a single specification.
How to Design a Cannabis LED Lighting Layout Step by Step
Designing a cannabis LED lighting layout starts with the growing area's dimensions and ends with measured light distribution at canopy level. Fixture count alone cannot guarantee adequate coverage because mounting height, optical design, fixture spacing, and room geometry all affect PPFD.
Step 1: Measure the Usable Canopy Area
Record the room's length and width, then identify the area that will actually contain plants. Separate aisles, equipment zones, access paths, and unused perimeter space from the productive canopy area.
For a rectangular canopy:
Canopy area = Length × Width
For example, a growing area measuring 20 feet by 40 feet has 800 square feet of gross floor area. If aisles and service areas occupy 120 square feet, the usable canopy area is 680 square feet.
Use the usable canopy area when making initial lighting estimates. The final design must also account for the shape and arrangement of the growing benches.
Step 2: Establish the Target PPFD and Photoperiod
Choose a PPFD target appropriate for the growth stage, cultivar, environmental conditions, and planned photoperiod. Convert PPFD to DLI to check whether the daily photon dose aligns with the cultivation plan.
DLI is calculated as:
DLI = PPFD × Hours of Light × 0.0036
For example, an average PPFD of 700 µmol/m²/s over 12 hours produces a DLI of 30.24 mol/m²/day.
Treat this as a planning example, not a universal target for every cultivar or facility. Light intensity should be adjusted according to plant response and environmental conditions.
Step 3: Review Fixture Performance Data
Compare fixtures using photosynthetic photon flux (PPF), photosynthetic photon efficacy (PPE), input power, and canopy-level PPFD distribution maps.
Look for distribution data that matches your intended mounting height and coverage area. A fixture's total photon output does not establish how evenly it will illuminate your particular room.
Step 4: Estimate Fixture Quantity and Electrical Demand
Use usable canopy area and the proposed fixture coverage as an initial estimate of fixture count. Then verify that the selected configuration can achieve the required average PPFD and acceptable edge coverage.
Calculate connected lighting load by multiplying fixture count by each fixture's actual input power. Include drivers, controls, and any supplemental lighting in the electrical design.
Do not finalize fixture quantity using watts per square foot alone. Manufacturer photometric data and room-specific calculations are necessary to confirm coverage.
Step 5: Determine Mounting Height, Spacing, and Orientation
Use fixture distribution maps to evaluate different mounting heights and spacing arrangements. Account for the distance between fixtures, canopy edges, wall reflectance, bench orientation, and the shape of the growing area.
For commercial rooms, compare several proposed arrangements before installation. The best configuration is the one that meets the required light levels and uniformity without creating unnecessary energy use or excessive intensity.
Step 6: Install, Map, and Adjust
After installation, measure PPFD at multiple points across the canopy using a calibrated quantum sensor. Record average, minimum, and maximum readings, then calculate the uniformity ratio.
Adjust spacing, height, orientation, or dimming based on the results. Repeat the measurements after significant canopy growth or changes to the lighting arrangement.
A lighting plan is complete only when measurements confirm that the installed system delivers the intended distribution.
Cannabis LED Lighting Layout Example: Estimating Fixture Count
Fixture quantity depends on usable canopy area, target PPFD, fixture photon output, and the proportion of emitted light that reaches the canopy. A simple calculation can provide an initial estimate, but the final layout must be verified using fixture-specific photometric data.
Example calculation
Assume a facility has:
Usable canopy area: 680 square feet
Target average PPFD: 800 µmol/m²/s
Fixture PPF: 2,800 µmol/s per fixture
Assumed fraction of emitted photons reaching the canopy: 80%
First, convert the canopy area to square meters:
680 square feet × 0.092903 = approximately 63.2 m².
Next, estimate the photon flux required at canopy level:
63.2 m² × 800 µmol/m²/s = approximately 50,560 µmol/s.
Estimate the useful photon output per fixture:
2,800 µmol/s × 0.80 = 2,240 µmol/s.
Finally, estimate the fixture quantity:
50,560 ÷ 2,240 = approximately 22.6 fixtures.
This gives an initial estimate of 23 fixtures.
What this estimate does and does not tell you
The calculation is a simplified photon-budget estimate. It does not establish whether 23 fixtures will produce the desired average PPFD or uniformity in a real room.
The assumed 80% delivery factor is illustrative, not a measured value. Actual results depend on fixture distribution, mounting height, room geometry, reflectance, and the position of the canopy relative to each fixture.
Before purchasing equipment, use manufacturer photometric files or a suitable lighting simulation to compare fixture count, spacing, mounting height, and expected edge coverage. After installation, confirm the design with canopy-level measurements.
Under-Canopy Lighting as a Layout Element
Under-canopy lighting (UCL), also called intracanopy or sub-canopy lighting, involves placing supplemental fixtures below or within the canopy to illuminate lower branches that overhead lights can’t reach. It’s no longer a niche technique. According to Cannabis Business Times’ 2024 State of the Lighting Market report, 65% of commercial growers considering adding lighting in the next 12 months want to explore ways to augment top lighting, and interest in intercanopy lighting grew 10 percentage points from 2023.
Peer-reviewed research published in May 2025 in MDPI Plants found that intracanopy lighting (ICL) produced the highest yield increases among supplemental configurations, showing a 29.95% increase in dry inflorescence yield, 24.4% higher THC accumulation, and a 12.5% increase in total terpene concentration.
The typical placement is 8 to 12 inches below the main canopy, with bars oriented upward. Studies consistently show that under-canopy lights can boost yields by 20 to 30% compared to overhead lights alone.
But honest reporting requires a caveat. Practitioners on grower forums note that results vary widely depending on baseline conditions. Some growers report 25 to 35% increases, while others see only 3 to 10% when the canopy was already well lit. The gains are real when the lower canopy is genuinely light-limited and the grower integrates nutrition and environment alongside the added light.
For layout planners, the important shift is treating UCL as part of the whole-room light budget, not a separate category. Your total light investment (top light + under-canopy) should be planned together. Read more about the data supporting this approach in this piece on under-canopy lighting research.
Explore the Boost XE, a 120W under-canopy bar designed specifically for this purpose.
Power Architecture Terms
LED Driver
The driver is the component that converts AC power into the regulated DC current an LED chip needs. Every LED fixture has one (or relies on an external one). Drivers generate heat, contain capacitors that degrade faster in warm and humid environments, and represent the most common failure point in LED systems.
Where the driver lives is a layout decision, not just an electrical one.
Remote and Centralized Power
One significant trend in commercial cannabis cultivation is relocating LED drivers from grow spaces to a centralized control space like an electrical room. This offers several practical benefits. The heat generated by drivers is easier to manage in a dry electrical room than in a warm, humid grow environment. Drivers with active electrical components like capacitors are more prone to failure in those conditions. Centralizing a few large drivers also simplifies servicing compared to managing hundreds of distributed units.
Since drivers aren’t washable, removing them from grow spaces reduces biosecurity risks. Large centralized drivers benefit from economies of scale, often significantly reducing the cost of the LED system. And the fixtures themselves become lighter and simpler, which matters when you’re hanging hundreds of them.
For facilities exploring this architecture, the OptiDrive platform offers both DC and low-voltage DE configurations compatible across an entire fixture line. Thrive’s related HVAC and heat management guide explains how driver relocation affects cooling load calculations.
0-10V Dimming
A standard dimming protocol where a low-voltage signal (0 to 10 volts) controls fixture output from 0 to 100%. Nearly all commercial LED grow lights support it.
Why it matters for your layout: Dimming is how you fine-tune PPFD after your physical layout (height, spacing) is set. Raising or lowering a fixture changes both intensity and uniformity. Dimming changes only intensity. Use height for distribution, dimming for dosing.
How to Map and Verify Your Layout
Planning a cannabis LED lighting layout on paper is necessary but not sufficient. You need to verify that the plan delivers what it promises at canopy level.
The 9-Point Grid Method
This is the standard verification technique. At canopy height, take PPFD readings at a minimum of 9 points arranged in a 3×3 grid across the grow area. For larger rooms, a 16-point (4×4) grid is better. Record each reading and calculate the average, minimum, and maximum.
Your target: ±10 to 15% variation from the average. If the minimum reading is less than 75% of the average, you have a uniformity problem that will show up in your harvest.
Practitioners recommend mapping at multiple stages, not just during initial setup. After canopy changes (defoliation, stretch during early flower, or significant growth spurts), the effective distance between fixture and canopy shifts. What was a uniform 750 average at week one of flower can become a non-uniform mess by week four if you don’t re-check and adjust.
PPFD Mapping: Example Measurement Table
Use a consistent measurement grid to identify hot spots, dark zones, and differences between the center and edges of the canopy.
The following example uses illustrative readings to demonstrate the process; it is not measured performance data from an actual facility.
Measurement point | Example PPFD (µmol/m²/s) |
|---|---|
Upper left | 720 |
Upper center | 780 |
Upper right | 710 |
Middle left | 760 |
Center | 840 |
Middle right | 770 |
Lower left | 700 |
Lower center | 790 |
Lower right | 730 |
Average | 755.6 |
Minimum | 700 |
Maximum | 840 |
Calculate the uniformity ratio using minimum PPFD divided by average PPFD:
700 ÷ 755.6 = approximately 0.93, or 93%.
This example illustrates a relatively even nine-point distribution, but it does not establish that the absolute intensity is appropriate for a particular crop stage.
For a reliable assessment, measure at consistent canopy height, keep sensor orientation consistent, and use enough points to represent the entire growing area. Larger or irregular rooms may need a denser grid. Repeat measurements when canopy height or fixture configuration changes significantly.
Important: A uniformity ratio cannot replace the average PPFD target. A room can have highly uniform lighting and still deliver too little or too much light.
Dimming vs. Distance for Fine-Tuning
After your initial map, resist the urge to lower fixtures to boost weak spots. Lowering a fixture narrows its footprint and can worsen uniformity even while increasing the center reading. Instead, if overall intensity is too low, increase wattage via the dimmer. If one zone is weak, consider adding a fixture rather than repositioning existing ones.
Common Cannabis LED Lighting Layout Mistakes
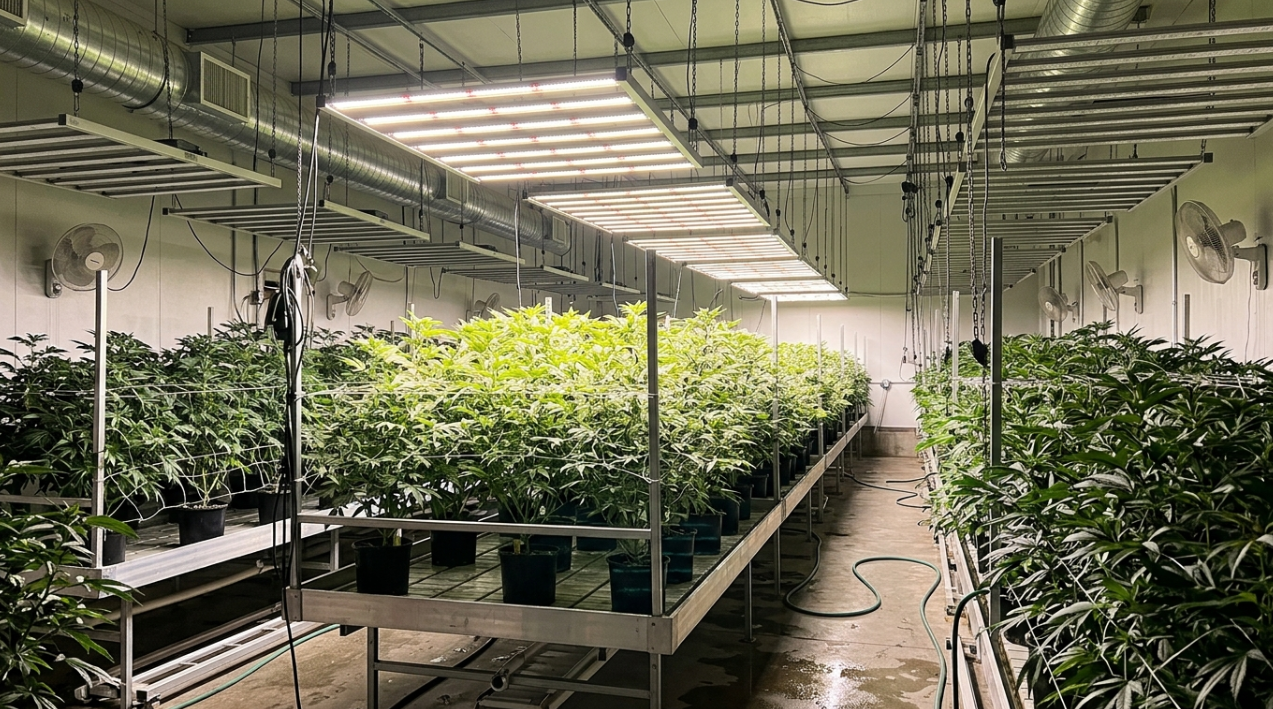
This section covers the errors that experienced growers and facility managers identify most often. Avoiding them will do more for your yield than any single equipment upgrade.
Treating LEDs Like HPS Replacements
One of the biggest misconceptions is that LEDs can simply replace HPS fixtures without changing anything else. LEDs distribute light differently, emit far less radiant heat, and interact with the plant canopy in fundamentally different ways. Running the same mounting heights, spacing, and environmental settings that worked for HPS often leads to over-lighting the canopy, poor penetration, cold leaf temperatures, and slower metabolic activity. If you’re transitioning, this breakdown of common LED vs. HPS mistakes is worth reading first.
Optimizing for Peak Intensity Instead of Uniformity
This mistake is everywhere. Commercial flower rooms are large, and the edges, corners, and spaces between fixtures all receive less light than the centers. Plants in those zones produce smaller, less dense flowers. In a room with 100 lights, even a 20% variance means a significant portion of the canopy is underperforming.
A uniform 750 average outperforms 1,100 in the center and 350 at the edge. Every time.
Measuring Only the Center
Related to the above, but worth calling out separately. A single center reading hides weak corners. If you’re evaluating a layout (or a fixture manufacturer’s claims), demand multi-point PPFD data. Any vendor who only publishes center readings is hiding something.
Ignoring Wall Reflectance
Wall reflectance is underestimated by most growers. Clean reflective surfaces significantly boost photon utilization at the edges of a room, exactly where light levels tend to drop off. But reflectance depends on consistent cleaning. A white wall that accumulates dust and residue over a grow cycle can drop reflectance enough to shift your uniformity ratio measurably. Budget for cleaning just like you budget for nutrient changes.
Not Recalibrating VPD and Temperature
Unlike HPS, LEDs emit minimal radiant heat toward the canopy. While this reduces cooling load, it changes how plants regulate temperature and transpiration. Leaf surface temperatures run cooler under LED, which means your VPD calculations from the HPS era are wrong. Growers must raise room air temperature (typically 3 to 5°F) and recalibrate VPD targets when switching to LED. The VPD management guide covers this in detail.
Overwatering Under LEDs
This is a hidden consequence of LED lighting layouts that rarely gets discussed in the context of light planning. Since LEDs put off less heat than HPS, plants naturally transpire less and need less water. Many growers continue watering at HPS rates, leading to overwatering, root issues, and a cascade of problems that look like nutrient deficiencies but are actually environmental.
When you change your lighting layout, recalibrate your irrigation schedule. They’re connected.
Not Adjusting Heights as Plants Grow
Your initial mounting height won’t stay correct for the entire cycle. Cannabis plants stretch significantly during the transition to flower, sometimes doubling in height over two weeks. If your facility doesn’t have the flexibility to raise fixtures as the canopy rises, you’ll end up with light burn on the tops and the same weak lower canopy you were trying to avoid. Build adjustability into your layout design from day one.
Rolling Bench Considerations
Most cannabis LED lighting layout content ignores rolling benches entirely, but a large percentage of commercial facilities use them. Rolling benches move, which means the relationship between fixture rows and plant rows changes throughout the day.
The layout must deliver uniform PPFD across every possible bench position, not just the position the benches happen to be in when you take a reading. This requires fixture rows oriented perpendicular to bench travel direction (or designed so that any bench position receives equivalent light). It also demands attention to wiring clearances, since cables and conduit need to accommodate bench movement without creating pinch points or shadows.
If you run rolling benches, verify your PPFD map with benches in at least three positions: fully left, center, and fully right.
Frequently Asked Questions
How many watts per square foot do cannabis LEDs need?
During flowering at ambient CO₂, most growers target 30 to 50 watts of actual draw per square foot. Vegetative stages need about 20 to 30W per square foot. But wattage is a rough guide. Two fixtures drawing 40W per square foot can produce very different PPFD maps. Always size your layout by PPFD targets, not watts.
How far should LED grow lights be from cannabis plants?
General guidance is 24 to 30 inches for seedlings and 12 to 24 inches for mature plants, but this varies significantly by fixture wattage and design. Higher-wattage fixtures need more distance. The right height is whatever produces your target PPFD with good uniformity. Measure, don’t guess.
What is a good uniformity ratio for a cannabis grow room?
A minimum of 0.75 (minimum PPFD divided by average PPFD). Commercial operations aiming for consistent grading should target 0.85 or higher. Below 0.70, edge plants produce noticeably smaller, less dense flowers.
Does under-canopy lighting actually increase yield?
Yes, when the lower canopy is genuinely light-limited. Peer-reviewed research shows yield increases up to 30% with intracanopy lighting. But growers on forums report that gains drop to 3 to 10% when the canopy is already well-lit through training or defoliation. UCL works best as part of an integrated layout, not as a fix for poor canopy management.
Should I dim my LEDs or raise them to reduce light intensity?
Raise them first to optimize uniformity, then use the dimmer to dial in target PPFD. Height changes affect both intensity and distribution. Dimming changes only intensity. Get your spread right with height, then fine-tune dosing with the dimmer.
How often should I re-map PPFD in my grow room?
At minimum, re-map after any significant canopy change: stretch during flower transition, major defoliation events, or topping. In practice, mapping at the start of each growth stage (veg, early flower, peak flower) catches most drift. For the cannabis light intensity targets at each stage, keep a reference chart posted in the grow room.
What’s the advantage of removing LED drivers from the grow room?
Centralized drivers remove heat from the canopy zone (reducing HVAC load), eliminate the most common in-room failure points, simplify cleaning and biosecurity protocols, and often reduce total system cost through economies of scale. For facilities running hundreds of fixtures, this is an operational decision that compounds over multiple grow cycles.
Ready to plan a cannabis LED lighting layout for your facility? Talk to a lighting specialist to get PPFD mapping and layout recommendations before you buy, not after.