Cannabis Light Intensity Guide 2026: PPFD by Stage
Master cannabis light intensity: measure PPFD and DLI, hit 2026 targets (seedling 100–300, veg 300–600, flower 800–1,000+), and prevent light burn.
TL;DR
Cannabis light intensity refers to the number of photosynthetically active photons hitting your canopy per second, measured in PPFD (µmol·m⁻²·s⁻¹), not lux or lumens. Seedlings need 100 to 300 PPFD, vegetative plants 300 to 600, and flowering plants 800 to 1,000+ depending on CO₂ levels. Pushing past 1,000 PPFD without supplemental CO₂ wastes electricity and risks light burn. Uniformity across the canopy and light penetration below the top colas matter just as much as peak intensity numbers.
What PPFD Does Cannabis Need?
Cannabis PPFD targets depend on the growth stage, photoperiod, cultivar, and growing environment. A practical starting reference is 100–300 µmol·m⁻²·s⁻¹ for seedlings and clones, 300–600 for vegetative growth, 600–800 during early flowering, and approximately 800–1,000 for established flowering plants under ambient CO₂. Higher intensities may be useful in a well-controlled environment with adequate CO₂, temperature, irrigation, and humidity management.
PPFD measures instantaneous light intensity at the canopy, while DLI measures the total light received over a day. Neither metric should be interpreted in isolation: the right target depends on how long plants receive light and whether the growing environment can support the additional photon load.
Light is the engine of cannabis production. Every gram of flower traces back to photons captured by leaves and converted into sugars, terpenes, and cannabinoids. But “more light” is not the same as “better light,” and the wrong metric can lead growers to waste thousands on fixtures that underperform or overshoot. Cannabis light intensity, measured correctly, is the single most important environmental variable a cultivator controls.
This guide covers what light intensity actually means for cannabis, how to measure it, how much you need at each growth stage, and the environmental factors that determine whether additional photons help or hurt.
Ready to size the right lighting for your facility? Talk with a lighting specialist about your PPFD targets and layout.
What Cannabis Light Intensity Actually Measures
Light intensity for cannabis growers means one thing: PPFD, or Photosynthetic Photon Flux Density. PPFD counts the number of photosynthetically active photons that land on a square meter of canopy every second. The unit is µmol·m⁻²·s⁻¹ (micromoles per square meter per second).
The photons that matter fall within the PAR range, which stands for Photosynthetically Active Radiation. PAR covers wavelengths from 400 to 700 nanometers, the portion of the visible spectrum that chlorophyll and accessory pigments use to drive photosynthesis.
Why Lux, Lumens, and Watts Are the Wrong Metrics
This is the most common measurement mistake in cannabis cultivation, and forum discussions confirm it comes up constantly. As one experienced grower on THCFarmer put it: “Lux is designed for measuring light for human use. You want to measure and talk in terms of PAR, not lux.”
The problem is straightforward. Lux and lumens weight wavelengths according to human visual sensitivity, which peaks in the green-yellow range around 555 nm. This means they systematically undercount the blue (400 to 500 nm) and red (600 to 700 nm) wavelengths that plants rely on most heavily. Two different lights could each read 50,000 lux but deliver completely different amounts of usable radiation to your plants.
Watts measure electrical input, not light output. A 600-watt fixture tells you nothing about how many photons reach the canopy. Lumens, lux, and foot candles should never be used as metrics for evaluating horticultural lighting.
For a deeper look at how spectrum interacts with intensity, see the impact of light spectra on plant growth.
How PPFD and DLI Work Together
PPFD captures a snapshot, the instantaneous flow rate of photons at a given moment. But cannabis plants don’t respond to moments. They respond to cumulative light exposure over the full photoperiod. That cumulative total is called DLI, or Daily Light Integral, measured in mol/m²/day.
Think of PPFD as the flow rate from a faucet and DLI as the total water collected in the bucket by the end of the day. A strong flow for a short period can fill the same bucket as a weaker flow over many hours. But the biological outcomes are not identical, because excessive instantaneous intensity can cause photoinhibition and stress even when the daily total is reasonable.
The DLI Formula
DLI = PPFD × (hours of light × 3,600) ÷ 1,000,000
Two quick examples make this concrete:
500 PPFD for 18 hours (vegetative photoperiod) = 32.4 mol/m²/day
500 PPFD for 12 hours (flowering photoperiod) = 21.6 mol/m²/day
Same intensity, very different daily totals. This is why growers entering flower often need to raise PPFD significantly just to maintain adequate DLI after cutting from 18 to 12 hours of light. For worked examples and crop-specific calculations, the DLI formula and conversion guide walks through the math step by step.
RRecommended Cannabis PPFD by Growth Stage
The appropriate photosynthetic photon flux density (PPFD) depends on plant development, photoperiod, cultivar, and environmental conditions. The following ranges are practical reference points, not universal requirements. Adjust intensity gradually and evaluate plant response rather than relying on a single target.
Growth stage | Indicative PPFD (µmol·m⁻²·s⁻¹) | Main consideration |
|---|---|---|
Seedlings and clones | 100–300 | Prioritize establishment and avoid excessive light stress |
Vegetative growth | 300–600 | Support leaf development, branching, and canopy formation |
Early flowering | 600–800 | Account for the transition, stretch, and changing canopy structure |
Established flowering, ambient CO₂ | 800–1,000 | Monitor environmental limits and signs of light stress |
High-light flowering, supplemented CO₂ | 1,000–1,500+ | Requires appropriate CO₂, temperature, irrigation, and environmental control |
These ranges overlap intentionally. Plant response depends on genetics, acclimation, canopy architecture, spectrum, and the surrounding environment. Higher PPFD does not guarantee a proportional increase in yield or flower quality.
How Photoperiod Changes DLI
Daily Light Integral (DLI) measures the total photosynthetically active photons received per square meter per day. At a constant PPFD, a longer photoperiod produces a higher DLI.
PPFD | DLI over 18 hours | DLI over 12 hours |
|---|---|---|
200 | 12.96 mol/m²/day | 8.64 mol/m²/day |
400 | 25.92 mol/m²/day | 17.28 mol/m²/day |
600 | 38.88 mol/m²/day | 25.92 mol/m²/day |
800 | 51.84 mol/m²/day | 34.56 mol/m²/day |
1,000 | 64.80 mol/m²/day | 43.20 mol/m²/day |
1,200 | 77.76 mol/m²/day | 51.84 mol/m²/day |
Formula: DLI = PPFD × photoperiod in hours × 3,600 ÷ 1,000,000.
These calculations assume constant PPFD throughout the photoperiod. They illustrate the mathematical relationship between intensity and duration; they are not universal recommendations for target DLI.
Why These Ranges Exist
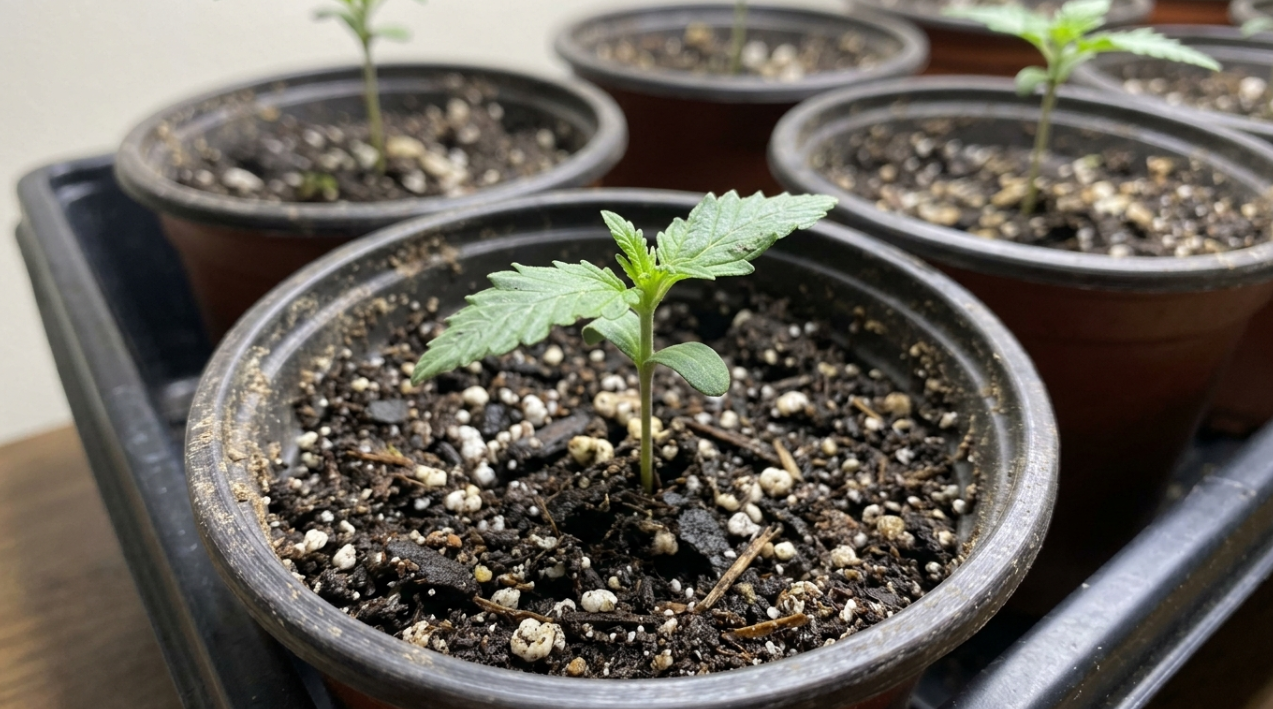
Seedlings and clones simply cannot process high-intensity light. Their root systems are immature, their leaf area is small, and photoprotective mechanisms are not fully developed. Blasting them with 800 PPFD does nothing productive and plenty that is harmful.
During veg, the goal is canopy fill and structural development. Moderate cannabis light intensity (300 to 600 PPFD) drives branching and leaf expansion without triggering the stretch response that comes from excess far-red or the stress that comes from excess total photon load.
Flower is where intensity pays for itself. Bud density, inflorescence weight, and harvest index all increase with higher PPFD, but only when the environment supports it.
For detailed stage-by-stage PPFD planning, the cannabis PPFD guide covers each phase in depth.
How CO₂ Affects Cannabis PPFD Requirements
Light and carbon dioxide work together during photosynthesis. As PPFD increases, plants may be able to use additional photons to support carbon assimilation and growth, but the response depends on CO₂ availability and other environmental conditions.
Under ambient CO₂, increasing light intensity eventually produces diminishing returns when photosynthesis becomes limited by factors other than light. Supplemental CO₂ can increase the potential benefit of higher PPFD, but it does not eliminate other constraints, such as leaf temperature, water availability, humidity, nutrient supply, and the plant's capacity to use additional energy.
For this reason, there is no single PPFD threshold that separates productive from unproductive lighting for every cannabis crop. Treat published intensity ranges as context-specific research findings, and evaluate them against the cultivar, environmental conditions, photoperiod, and lighting system being used.
Does Cannabis Always Benefit From More Light?
No. Increasing PPFD can improve productivity when light is limiting, but the response is not unlimited. At sufficiently high exposure, additional photons can produce diminishing returns or contribute to photoinhibition and stress.
The practical question is whether the extra light produces enough additional usable biomass to justify the associated electricity, cooling, CO₂, and operating costs. That decision requires both plant-performance data and facility-level economics.
The 1% Rule and Where It Breaks Down
Research published in Cannabis Business Times found that “the best value was around that 1,800 micromole level for cannabis. As we start increasing from 1,000 micromoles up to 1,800, we saw about a 1% increase in yield for every 1% increase in light intensity. That started to diminish from 1,800 to 2,500.”
This linear relationship is powerful, but it only holds when CO₂ and other environmental factors keep pace. For growers looking at the role of CO₂ in controlled environment agriculture, the relationship between gas concentration and photon capture is worth understanding before investing in higher-output fixtures.
VPD Matters Too
As cannabis light intensity rises, transpiration increases and the vapor pressure deficit between the leaf and surrounding air changes. If VPD gets too high, stomata close to conserve water, which blocks CO₂ uptake and negates the benefit of additional light. Managing VPD in cannabis cultivation becomes increasingly critical at PPFD levels above 800.
What Happens When Cannabis Light Intensity Is Too High
More photons are not always better. When intensity exceeds what the plant’s photosynthetic machinery can process, excess energy damages chloroplasts, bleaches pigments, and reduces both yield and quality.
Recognizing Light Stress
The first sign is often that upper leaves begin pointing straight up, sometimes called “praying” or “tacoing.” This is the plant’s attempt to reduce the leaf surface area exposed to the light source.
If intensity stays too high, leaf yellowing appears at the top of the canopy, directly under the fixtures. The veins stay green while the tissue between them turns yellow and burnt. This is easily confused with nitrogen deficiency, but the distinction is important: nitrogen-deficient leaves fall off on their own, while light-burned leaves stay attached.
In severe cases, flowers bleach white. The tissue loses all pigmentation and the buds become worthless.
Cannabis Light Stress: Symptoms, Possible Causes, and Checks
Observed symptom | Possible explanation | What to check |
|---|---|---|
Bleaching on upper leaves or flowers | Excessive light exposure or combined light and heat stress | PPFD at the affected canopy position, fixture distance, and leaf temperature |
Upward leaf curling or “tacoing” | Heat stress, high transpiration demand, or excessive light exposure | Leaf temperature, airflow, humidity, VPD, and local PPFD |
Yellowing concentrated near the top of the canopy | Light stress, heat stress, or a nutrient-related problem | Distribution of symptoms, root-zone conditions, nutrient management, and canopy readings |
Uneven growth across the room | Uneven PPFD distribution or differences in plant development | Center, edge, and corner readings; fixture placement; canopy height |
Small or underdeveloped lower flowers | Low light penetration, shading, or differences in plant development | Lower-canopy light levels, canopy density, and plant structure |
These symptoms are not diagnostic on their own. Leaf curling, yellowing, and bleaching can have multiple causes, so compare symptoms across the canopy with measured PPFD and environmental conditions before attributing them to lighting.
How to Respond to Suspected Light Stress
Avoid increasing light output until the cause of the symptoms is understood. Check canopy-level PPFD, leaf temperature, airflow, humidity, water availability, and nutrient conditions. If excessive light is the likely cause, reduce exposure or increase the distance between the fixtures and canopy, then monitor the plant response.
When raising light intensity, use gradual adjustments and reassess the canopy after each change. The appropriate adjustment depends on the severity of symptoms, plant condition, and environmental stability.
The Acclimation Protocol
The fix is simple but requires patience. Raise PPFD by no more than 100 to 150 µmol·m⁻²·s⁻¹ every 3 to 5 days. This gives the plant time to upregulate photoprotective pigments and adjust enzyme concentrations. Jumping from vegetative intensity to peak flowering intensity overnight is one of the fastest ways to damage a crop.
Understanding how much HVAC you need to cool your grow lights is also part of this equation, because increasing intensity raises both photon load and thermal load in the room.
Light Intensity Below the Canopy
Almost every discussion of cannabis light intensity focuses on the top of the canopy. That is only half the story.
Cannabis develops a dense upper canopy that absorbs and reflects the vast majority of incoming photons. Even when overhead fixtures deliver 1,000 to 1,200 µmol/m²/s at the top colas, intensity drops exponentially as light travels downward. By the time photons reach the middle and lower branches, intensity falls below the photosynthetic compensation threshold, the point where the leaf produces less sugar than it consumes through respiration.
The result is familiar to every grower: dense, marketable flower at the top and loose, underdeveloped “larf” at the bottom.
Why Under-Canopy Lighting Changes the Math
Under-canopy LED bars bypass the canopy barrier entirely, delivering light directly to the lower two-thirds of the plant. For cannabis, this means lower nodes produce dense, marketable flower instead of waste. The yield gain comes not from driving the top of the plant harder but from activating tissue that overhead fixtures physically cannot reach.
For facilities looking to increase yield without increasing total overhead wattage, under-canopy LED bars offer a proven approach to closing the vertical light gap.
Read why under-canopy lighting has moved past the experimental stage and into standard commercial practice.
Measuring Cannabis Light Intensity Correctly
How to Measure PPFD Across a Cannabis Canopy
A single PPFD reading cannot show whether an entire growing area receives consistent light. To understand actual canopy exposure, measure multiple locations at the same height as the plant canopy.
Use this checklist when assessing a lighting setup:
Measure at canopy height. Position the quantum sensor at the level of the leaves receiving the light, with the sensor oriented according to the meter manufacturer's instructions.
Use a consistent measurement grid. Take readings at the center, corners, edges, and intermediate points across the growing footprint.
Record the operating conditions. Note fixture height, dimming level, photoperiod, sensor model, and whether supplemental lighting is operating.
Compare the readings. Identify hotspots and underlit areas rather than relying only on the highest measurement.
Calculate average PPFD. Add the readings and divide by the number of measurement points, using a consistent grid that represents the canopy area.
Recheck after adjustments. Repeat the measurements after changing fixture height, output, spacing, or canopy arrangement.
How to Assess Light Uniformity
A useful way to describe light distribution is the minimum-to-average PPFD ratio:
Uniformity ratio = minimum measured PPFD ÷ average measured PPFD
For example, if the minimum reading is 600 PPFD and the average is 800 PPFD, the ratio is 0.75, or 75%.
This ratio helps identify uneven distribution, but it is not a universal pass/fail threshold. Evaluate the full measurement map, the maximum reading, the crop's light requirements, and the intended design specification together.
Equipment
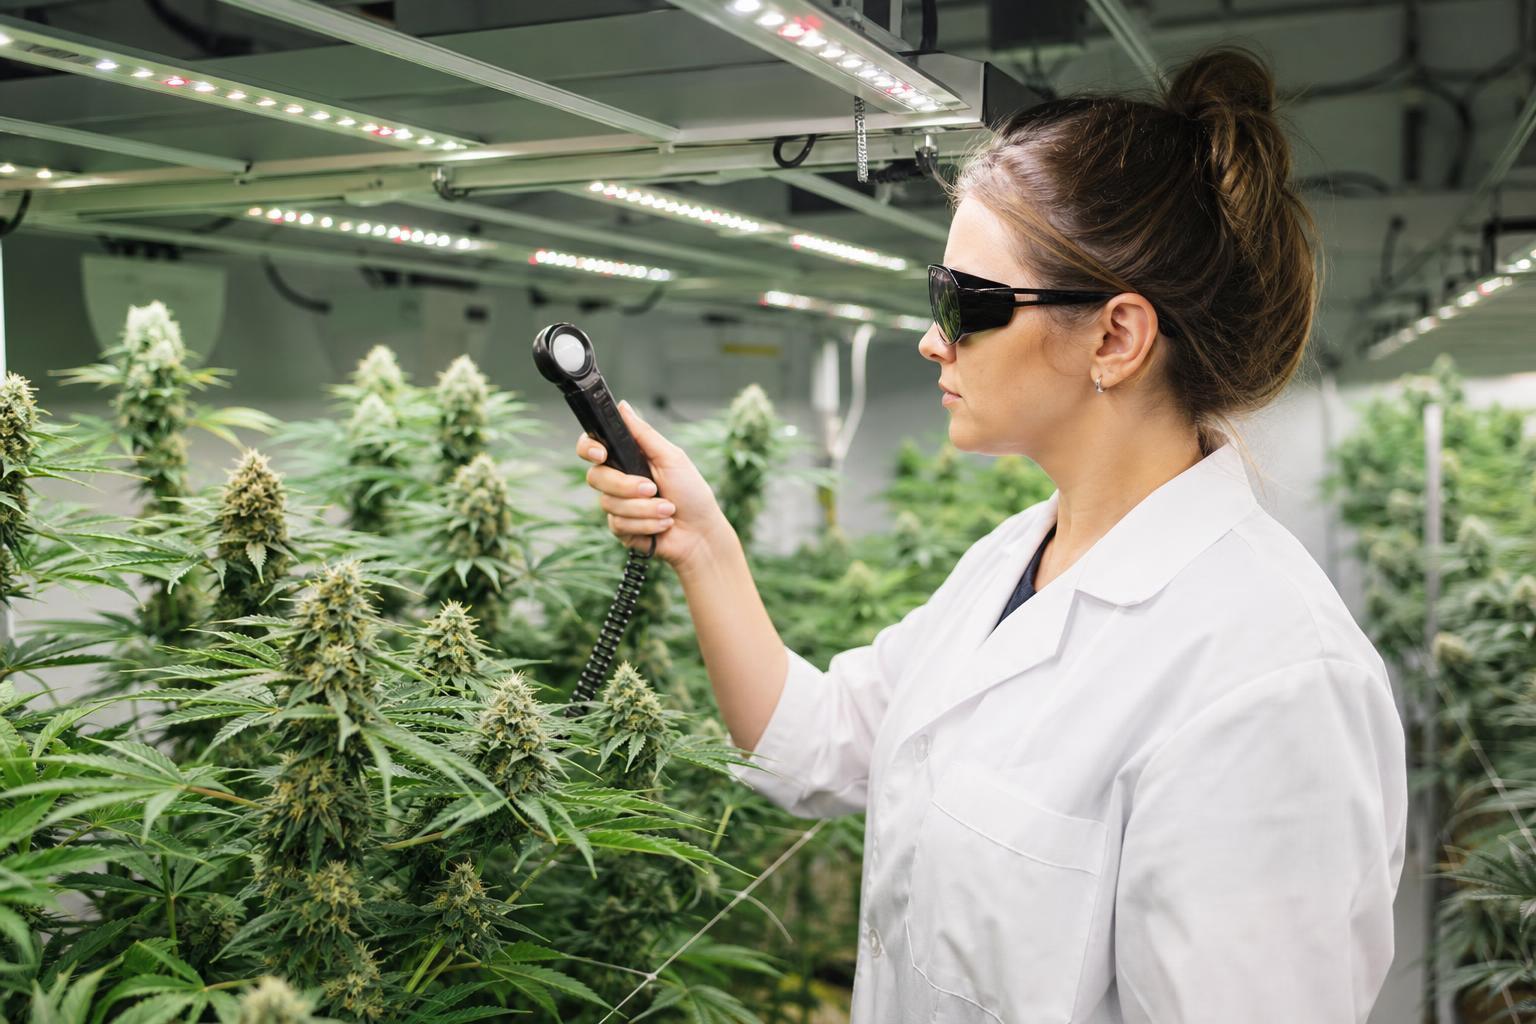
The gold standard is a quantum sensor (PAR meter) like the Apogee MQ-600, which reads PPFD directly. Handheld models cost a few hundred dollars. For commercial operations, mapping PPFD across an entire canopy at multiple points is not optional, it is the only way to know what your plants are actually receiving.
The Lux Workaround
For growers who only have a lux meter, an approximate conversion exists for white LEDs around 4000K color temperature:
PPFD ≈ lux ÷ 67
This is a rough estimate. It breaks down with non-white spectra (blurple or red-heavy fixtures), and it should not replace a proper PAR meter for any commercial application.
Uniformity: The Metric Nobody Talks About
Peak PPFD at the center of the canopy means little if the edges are 40% dimmer. Commercial cultivators should target a minimum-to-average PPFD ratio of 0.75 or higher across the entire footprint. Anything lower means hotspots at the center (causing bleaching or stress) while perimeter plants stay underlit and underperform.
Achieving tight uniformity depends on fixture spacing, mounting height, and optical design. Facilities that hit tight design-to-install PPFD variance produce more consistent crops and waste less energy on light that either goes unused or causes damage.
The Leaf Isn’t the Plant: A Key Research Insight
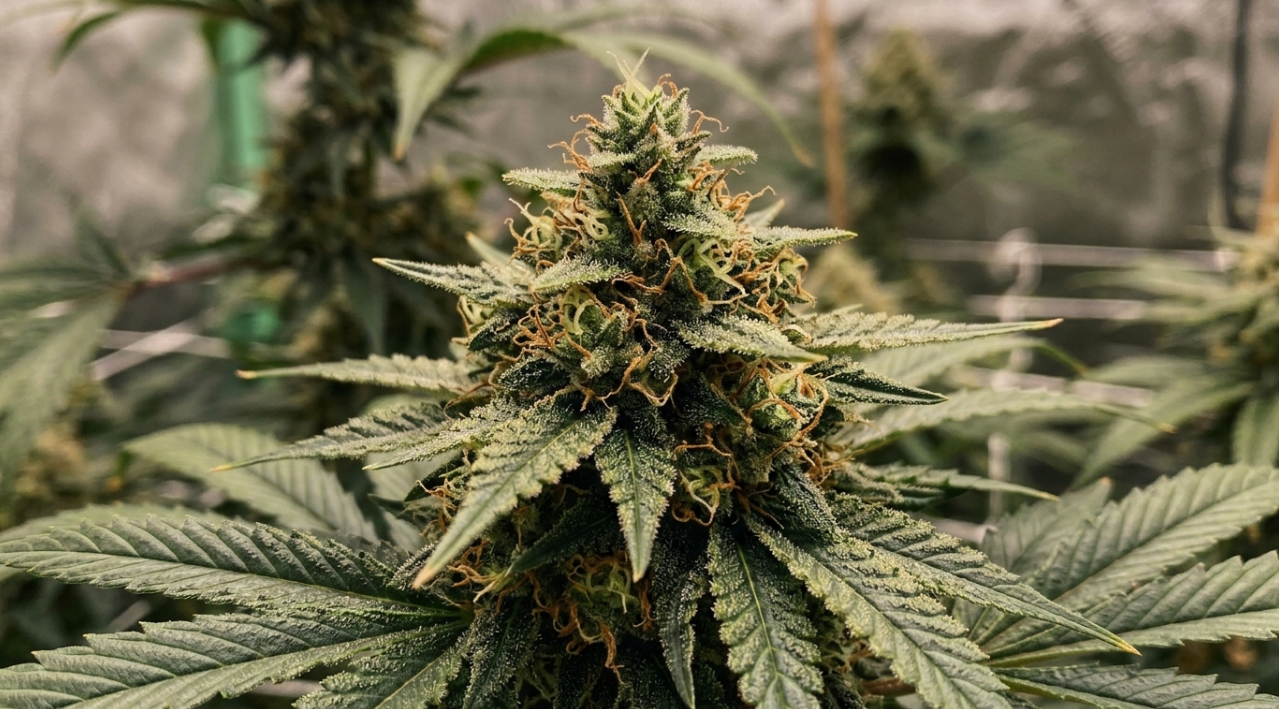
One of the most counterintuitive findings in cannabis lighting research comes from the University of Guelph. Rodriguez-Morrison et al. (2021) found that dry inflorescence yield increased linearly with increasing canopy-level PPFD all the way up to 1,800 µmol·m⁻²·s⁻¹, even though individual leaf photosynthesis saturated well below that level.
How is that possible? Because a whole plant is not a single leaf. Higher overhead intensity pushes photons deeper into the canopy, activating middle and lower leaves that would otherwise sit in near-darkness. The density of the apical inflorescence and harvest index also increased linearly, meaning more of the plant’s total biomass ended up as marketable flower rather than stems and leaves.
Importantly, there were no treatment effects on cannabinoid potency. More light produced more flower of the same quality, not diluted flower.
A follow-up study by Llewellyn et al. (2022) confirmed that inflorescence dry weight was 1.6 times higher in the highest versus lowest PPFD treatments, a larger gain than any other biomass metric measured.
How to Interpret Cannabis Lighting Research
Cannabis lighting studies do not establish a single optimal PPFD for every growing environment. Results depend on factors such as cultivar, canopy structure, photoperiod, CO₂ concentration, temperature, and the duration of the experiment. A reported increase in flower yield also does not automatically imply a proportional increase in cannabinoid concentration or profitability.
When comparing research findings, distinguish between fresh and dry biomass, inflorescence yield and total plant biomass, cannabinoid concentration and total cannabinoid yield, and experimental outcomes versus commercial operating results. These distinctions help growers apply research findings without assuming that every reported benefit will transfer directly to their own facilities.
Cannabinoid Biosynthesis and Light
Research from Chungnam National University (Hahm et al., 2025) found that CBD, CBDA, and THCA levels increased linearly with light intensity up to 600 µmol/m²/s, with total CBD increasing 36.88% at 600 compared to 200 µmol/m²/s. Light intensity doesn’t just affect yield, it directly influences the biosynthesis of the compounds that make cannabis valuable.
The Economics of Cannabis Light Intensity
Lighting-related costs account for roughly 60% of total energy used in indoor cannabis production, as cited by Rodriguez-Morrison et al. Electricity can represent 25% or more of total production costs, and in high-rate markets like California or the Northeast, energy expenses can reach $300 to $500 per pound of cannabis produced.
The economic question is not “how much light can I install?” but “does the marginal yield pay for the marginal electricity?”
Based on the Guelph research, the answer is yes across a wide range. For all the light intensity levels considered in their studies, the value of the gain in yields from increasing cannabis light intensity far exceeded the cost of additional electricity. But that equation depends on local energy rates, CO₂ costs, HVAC load, and the wholesale price of flower.
For strategies on managing these costs, read about reducing operating expenses in cannabis and food production facilities.
Sizing a commercial flower room or planning an expansion? Request a free consultation to get PPFD layouts matched to your facility, crop goals, and energy budget.
Frequently Asked Questions
What is a good PPFD for cannabis?
It depends on the growth stage. Seedlings do well at 100 to 300 µmol/m²/s, vegetative plants at 300 to 600, and flowering plants at 800 to 1,000 under ambient CO₂. With CO₂ supplementation above 1,000 ppm, flowering plants can use 1,200 to 1,500+ PPFD productively.
Can you give cannabis too much light?
Yes. Without adequate CO₂, temperatures, and humidity management, pushing PPFD above 1,000 causes light burn, bleaching, and reduced yields. Even with CO₂, research shows diminishing returns above 1,800 PPFD. Always acclimate plants gradually, raising intensity by 100 to 150 µmol every 3 to 5 days.
Is lux the same as PPFD?
No. Lux measures light as perceived by the human eye and underweights the blue and red wavelengths plants depend on. Two fixtures can read the same lux and deliver very different PPFD values. For white LEDs around 4000K, you can estimate PPFD by dividing lux by 67, but a proper PAR meter is far more reliable.
How does CO₂ affect cannabis light intensity requirements?
CO₂ is the raw material photosynthesis uses alongside light energy. At ambient levels (~400 ppm), cannabis becomes CO₂-limited around 700 to 1,000 PPFD. Supplementing to 1,000 to 1,200 ppm raises the light saturation point to 1,200 to 1,500+ PPFD, meaning plants convert more photons into yield instead of wasting them.
What is DLI and why does it matter for cannabis?
DLI (Daily Light Integral) is the total number of photosynthetically active photons delivered per square meter over an entire day. It accounts for both intensity and duration. Cannabis in flower typically needs 35 to 65 mol/m²/day depending on cultivar and CO₂ levels. Two grows with the same DLI but different PPFD levels will not produce identical results, because very high instantaneous intensity can cause stress even when the daily total is moderate.
Why do lower buds stay small even with powerful overhead lights?
The upper canopy absorbs most incoming photons, creating an exponential light gradient. By the time light reaches the lower third of the plant, intensity drops below the level needed for productive photosynthesis. This is why lower nodes produce loose, airy flower. Under-canopy supplemental lighting solves this by delivering photons directly to lower branches.
How do I measure cannabis light intensity correctly?
Use a quantum sensor (PAR meter) that reads PPFD directly. Measure at canopy height at multiple points across the footprint to capture both peak and edge values. Calculate the minimum-to-average ratio and aim for 0.75 or higher. A single center reading tells you almost nothing about what most of your plants are experiencing.
Does higher light intensity increase THC or CBD levels?
Research from Chungnam National University found that cannabinoid concentrations (CBD, CBDA, THCA) increased linearly with light intensity up to 600 µmol/m²/s. The Guelph studies found no change in cannabinoid potency at higher intensities, but total cannabinoid yield per plant increased because flower mass increased. More light produces more flower with at least the same potency.