Greenhouse Lighting ROI: 2026 Guide to 9 Key Factors
Learn how to calculate greenhouse lighting ROI in 2026—payback, energy savings, rebates, yield gains, and HVAC effects. Start with your DLI gap.
TLDR
Greenhouse lighting ROI measures whether supplemental or replacement grow lights pay back through energy savings, yield gains, rebates, maintenance savings, and climate control changes. The best calculations start with your crop’s daily light integral (DLI) gap, not fixture wattage. LEDs often win on efficiency and maintenance, but HPS heat can still pencil out in cold climate greenhouses. A real ROI number requires facility specific data on electricity rates, operating hours, crop value, and environmental control costs.
Direct Answer: What Drives Greenhouse Lighting ROI?
Greenhouse lighting ROI is primarily driven by nine variables:
Electricity rates
Annual lighting hours
Crop DLI requirements
Fixture efficacy (µmol/J)
Utility rebates and incentives
Fixture lifespan and maintenance costs
Yield and crop quality improvements
Heating, cooling, and dehumidification impacts
Environmental control factors such as CO₂ and humidity
For most commercial greenhouses, the largest ROI drivers are the crop’s DLI gap, electricity costs, and yield response. Energy savings alone rarely provide the full financial picture.
Greenhouse Lighting ROI at a Glance
Factor | Impact on ROI | Importance |
|---|---|---|
DLI Gap | Determines required supplemental light | Very High |
Electricity Cost | Controls operating expenses | Very High |
Fixture Efficacy | Affects photon cost | Very High |
Yield Improvement | Drives revenue gains | Very High |
Rebates | Reduces project cost | High |
Heating/Cooling Effects | Alters total energy cost | High |
Maintenance Savings | Reduces lifetime cost | Medium |
Uniformity | Improves crop consistency | Medium |
Environmental Controls | Prevents wasted lighting investment | Medium |
What Is Greenhouse Lighting ROI?
Greenhouse lighting ROI is the financial return a grower earns from investing in supplemental or replacement grow lights. It compares the total project cost (fixtures, installation, controls, electrical work, and ongoing maintenance) against the value created through lower energy use, utility rebates, longer fixture life, improved crop yield, better quality, and climate control savings.
For growers, it answers a simple question: will these lights make or save more money than they cost?
The reason this concept matters so much in commercial greenhouse operations is that lighting is often the single largest electricity expense. But unlike indoor grows, greenhouses already receive sunlight. That means the value of supplemental lighting depends on when natural light falls short, how much extra light actually reaches the crop, and how the crop responds to it.
Purdue University’s greenhouse lighting economics guide makes this point clearly: growers should compare the cost of adding one mole of supplemental light against the added crop value that mole produces. That mol based logic is a better decision framework than comparing watts or fixture prices in isolation.
A common best practice is to build greenhouse lighting business cases over a 5 to 10 year horizon and include total cost of ownership, sunlight contribution, electricity costs, and production impact per kilogram of output. When growers skip any of these factors, the ROI calculation is incomplete. For a deeper look at how supplemental lighting works in practice, start with actual DLI data from your facility.
Greenhouse Lighting ROI Formula
Here are the formulas that matter. Start with the basic ROI percentage:
ROI (%) = (Net financial benefit from the lighting project / Total project cost) x 100
Where net financial benefit equals:
Energy savings + maintenance savings + rebate value + added crop revenue + climate control savings, minus any added operating costs, replacement costs, or new expenses the project creates.
For simple payback period:
Simple payback (years) = Net project cost / Annual net benefit
For annual lighting electricity cost (useful when comparing two systems):
Annual lighting energy cost = Fixture kW x annual operating hours x electricity rate x fixture count
And for calculating supplemental DLI contribution:
DLI (mol/m²/day) = PPFD x photoperiod hours x 3,600 / 1,000,000
An important distinction: if you only calculate kWh savings, you are estimating energy payback, not full greenhouse lighting ROI. The complete picture includes crop revenue changes, maintenance differences, incentive value, and climate system impacts.
For a deeper look at how operating costs compound across CEA facilities, see this guide on reducing operating expenses in cannabis and food production.
Step by Step ROI Calculation
Many growers stall at the formula stage because they are unsure what order to follow. Here is a practical sequence that produces a reliable greenhouse lighting ROI estimate, not just an energy payback number.
Step 1: Quantify the DLI gap. Measure your in greenhouse DLI by month using a quantum sensor or logger. Compare it to your crop’s target DLI. The difference is the supplemental light you actually need. For crop specific DLI targets, this greenhouse light levels guide breaks down requirements by species.
Step 2: Size the lighting system. Convert the DLI gap into the required PPFD and photoperiod, then determine fixture count and wattage. Use the DLI formula above: if you need 8 mol/m²/day of supplemental light over 16 hours, you need roughly 139 µmol/m²/s of PPFD from your fixtures.
Step 3: Calculate annual energy cost. Multiply fixture kW by annual operating hours by your blended electricity rate (including demand charges) by fixture count.
Step 4: Estimate crop revenue impact. Quantify expected yield improvement using trial data, university benchmarks, or supplier documentation. Multiply the incremental yield by your crop’s per unit market value.
Step 5: Add maintenance and climate control savings. Include reduced bulb replacement, labor savings, and any HVAC changes. If switching from HPS to LED, account for reduced cooling load in warm months and potentially increased heating costs in winter.
Step 6: Apply rebates and incentives. Subtract confirmed rebate amounts from total project cost. Only include rebates you have prequalified for, not hypothetical ones.
Step 7: Run the math. Simple payback = (Total project cost minus rebates) / (Annual energy savings + maintenance savings + crop revenue gain + climate savings). ROI percentage = (Annual net benefit / Net project cost) x 100.
Step 8: Sensitivity test. Run the calculation again at higher electricity rates (+20%), lower crop prices ( minus 15%), and without rebates. If the project still pays back within your acceptable window under pessimistic assumptions, it is a strong investment.
Practitioners on Reddit’s commercial growing forums frequently point out that growers who skip steps 1 and 4 end up with energy only payback numbers that look worse than the actual project economics. The crop revenue piece, especially for high value crops, often cuts payback in half.
ROI Example Calculation: Full Project Analysis
The energy only example later in this article shows a 5.1 year payback. Here is what happens when the full picture is included.
Scenario:
Existing system: 100 units of 1000W HPS
Replacement: 100 units of 600W LED at 3.0 µmol/J
Net installed cost after $30,000 utility rebate: $120,000
Operating schedule: 12 hours/day, 365 days/year (4,380 hours)
Electricity rate: $0.134/kWh
Crop: greenhouse tomatoes valued at $250,000/year
Expected yield improvement: 8%
Annual maintenance savings (no bulb changes, less labor): $5,000
HVAC impact: $3,000 net cooling savings annually (warm climate facility)
Annual benefits breakdown:
Benefit Category | Annual Value |
|---|---|
Energy savings (400W x 4,380 hrs x $0.134 x 100) | $23,476 |
Crop revenue gain (8% of $250,000) | $20,000 |
Maintenance savings | $5,000 |
HVAC/cooling savings | $3,000 |
Total annual benefit | $51,476 |
Simple payback: $120,000 / $51,476 = 2.3 years
Compare that to the 5.1 year payback from energy savings alone. The crop revenue and maintenance savings nearly cut the payback period in half. This is why energy only ROI calculations consistently understate the true return.
A cold climate version of the same project would look different. If the facility relied on HPS heat to offset winter heating, the HVAC line might flip to a $4,000 added heating cost instead of a $3,000 savings, stretching payback to roughly 2.7 years. Still strong, but the point is clear: climate effects change the number materially.
Greenhouse Lighting ROI Calculator Inputs
Before calculating ROI, gather the following inputs:
Input | Example |
|---|---|
Fixture Type | 1000W HPS |
Replacement Fixture | 600W LED |
Fixture Count | 100 |
Annual Runtime | 4,380 hours |
Electricity Rate | $0.134/kWh |
Utility Rebate | $30,000 |
Annual Maintenance Savings | $5,000 |
Expected Yield Increase | 8% |
Crop Value | $250,000/year |
Without these inputs, ROI estimates are often inaccurate because they exclude crop revenue and environmental impacts.
Greenhouse Lighting ROI Benchmarks in 2026
Many growers ask whether their projected payback is good or bad. While every greenhouse is unique, commercial lighting projects generally fall within these ranges.
Payback Period | Assessment |
|---|---|
Under 2 years | Exceptional |
2 to 4 years | Strong ROI |
4 to 6 years | Typical commercial project |
6 to 8 years | Marginal; requires additional benefits |
Over 8 years | Often difficult to justify |
Projects with high value crops, expensive electricity, and available rebates often achieve the fastest payback. Projects relying only on energy savings typically produce longer payback periods.
Payback Factor: What It Is and When to Use It
The payback factor is a quick screening metric that some lighting suppliers and energy consultants use before running a full ROI analysis. It expresses the ratio of annual operating cost savings to net capital investment, essentially the inverse of simple payback expressed as a decimal rather than in years.
Payback factor = Annual net savings / Net project cost
A payback factor of 0.33 means the project returns 33% of its cost each year, corresponding to a roughly 3 year simple payback. A factor above 0.25 (4 year payback or faster) is generally considered attractive for greenhouse lighting projects. Below 0.15, the project needs strong crop revenue gains or rebates to be viable.
The payback factor is useful for quickly comparing multiple project options, but it should not replace a full life cycle analysis. It ignores the time value of money, escalating electricity rates, and crop revenue changes. Use it to filter, not to decide.
What Affects Greenhouse Lighting ROI?
Nine variables drive most of the variation in greenhouse lighting returns. Each one can shift a project from profitable to marginal, or vice versa.
Electricity Rate and Operating Hours
Lighting ROI is extremely sensitive to power cost and runtime. A fixture running 3 to 4 hours per day in a seasonal greenhouse has a completely different payback than one running 16 to 20 hours daily during winter production.
U.S. commercial electricity averaged about 13.41 cents per kWh in 2025, but regional differences are enormous. Growers must use their own blended rate, including energy, demand charges, delivery, and taxes. A grower in the Pacific Northwest paying 5 cents per kWh faces a very different calculation than one in New England paying 22 cents.
Industry feedback highlights an important caveat: in some regions, cheap electricity combined with the useful heat from HPS fixtures can delay LED payback. That is not universal, but it is a consideration commercial operators should account for.
DLI Gap
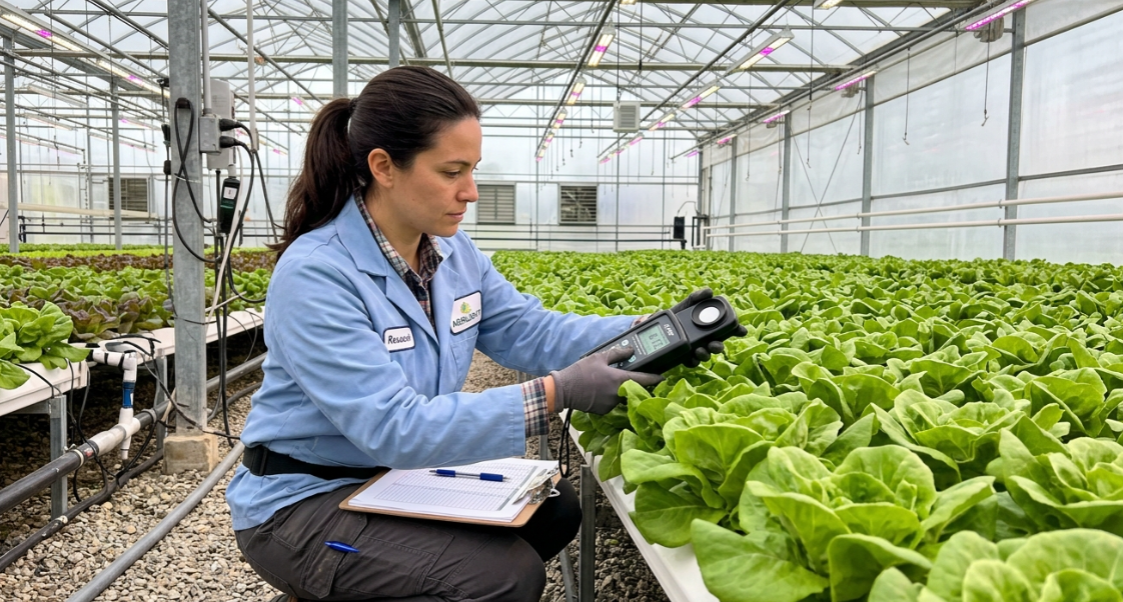
This is the most greenhouse specific variable in the entire calculation, and the one most frequently ignored.
DLI (daily light integral) measures the total photosynthetic light a crop receives in a day. Since greenhouses already receive sunlight, supplemental lighting ROI depends on the gap between your crop’s target DLI and what sunlight actually delivers inside the greenhouse.
Purdue lists approximate DLI needs: propagation material requires 8 to 10 mol/m²/day, potted plants 10 to 15, leafy greens 15 to 20, and tomatoes or strawberries above 20. Winter sunlight inside greenhouses in Indiana and surrounding states drops to roughly 5 mol/m²/day, making supplemental lighting essential for quality winter production.
Ohio State adds that greenhouse structures and glazing alone can cut DLI by 30 to 50 percent. A greenhouse lighting ROI calculation should start with the missing DLI instead of fixture wattage. For detailed DLI calculations and seasonal targets, see this DLI greenhouse guide.
Fixture Efficacy
Photosynthetic photon efficacy (PPE) measures how efficiently a fixture converts electricity into photosynthetic photons, expressed as µmol/J. This is the metric that connects energy cost to crop usable light output.
Ohio State reports that conventional HPS lamps convert energy to photons at roughly 1.0 to 1.7 µmol/J, while high efficiency LEDs now exceed 3.0 µmol/J. The DesignLights Consortium’s horticultural lighting requirements (Version 3.0) set a minimum of 2.30 µmol/J for qualified products.
Watts drive your power bill. PPE reflects how efficiently a fixture turns that power into usable light for plants. When calculating lighting ROI, focus on delivered photons per watt, not the headline wattage. Many growers have found that wattage only comparisons lead to expensive mistakes. If you want the deeper explanation, see the common LED vs. HPS comparison pitfalls.
Rebates and Incentives
Rebates can dramatically shorten payback, but they are local, administrative, and time sensitive. Energy Trust of Oregon’s market research found that incentives were a key reason growers purchased LED grow lights. Trade allies in the study reported that LED fixtures cost more than twice the price of HID at retail without incentives, and up to four times more in the business market.
The catch: most utility programs require fixtures on the DLC Horticultural Qualified Products List, preapproval before purchase, and involvement of a trade ally. Some trade allies in the Energy Trust study reported the preapproval process and paperwork could be onerous.
To understand what DLC listing means for your purchase, see this explanation of DLC listed LED grow lights. For a walkthrough of rebate eligibility steps, that guide covers the application process.
Rebates reduce the denominator in the ROI equation (net project cost), but growers must confirm eligibility before purchasing. Assuming rebates after the fact is one of the most common and costly mistakes in lighting ROI calculations.
Fixture Life and Maintenance
LED systems commonly have 40,000 to 50,000 hour lifespans, while HPS systems average 20,000 to 30,000 hours, according to a Cultivate '22 panel summarized by Country Culture. DLC Version 3.0 requires Q90 of at least 36,000 hours for photon flux maintenance, driver lifetime of 50,000 hours or more, and fixture warranties of at least 5 years.
Total cost should include electricity, bulb replacement, labor for relamping, fixture cleaning, and output degradation over time. A fixture that looks cheaper upfront but needs new lamps every 10,000 hours and loses 20% output before replacement can quietly erode ROI year after year.
Yield and Crop Quality
For high value crops, crop revenue impact often dominates the greenhouse lighting ROI equation, overshadowing energy savings entirely.
A Frontiers in Plant Science meta analysis covering 31 papers and 100 observations found that supplemental LED lighting improved greenhouse truss tomato yield by 40%, soluble solids by 6%, and photosynthetic capacity by 50% versus control conditions. For more on tomato specific lighting, see tomato DLI and PPFD targets.
Purdue’s lettuce example is more granular. It estimated lettuce produced about 6.8 grams of additional fresh mass per mole of supplemental light. At $2.50 per pound, that worked out to 3.78 cents of added crop value per mole, compared with 3.1 cents of lighting cost per mole. Positive ROI, but by a thin margin that changes with electricity rates, lettuce prices, or fixture efficiency.
Growers at the Cultivate '22 panel reported observing better seedling consistency, less throwaway material, improved root growth, and reduced crop time after switching to LEDs. These quality and timing benefits are hard to model in advance but can be meaningful revenue drivers.
Spectrum Matched to Crop Requirements
Spectrum selection is often treated as a marketing conversation, but it has real financial consequences. The wrong spectrum can reduce the value of every photon delivered, which directly affects greenhouse lighting ROI even when energy costs look favorable.
For most greenhouse supplemental lighting, full spectrum white light performs well across a wide range of crops. It provides a balanced photosynthetically active radiation (PAR) profile, creates a natural working environment for employees, and avoids the need for crop specific spectral adjustments.
Research compiled by Purdue and Ohio State indicates that blue light promotes compact growth and can reduce stretch in ornamentals and transplants, while red light drives photosynthetic efficiency. Far red wavelengths influence flowering timing and stem elongation. These effects matter, but for commercial greenhouse supplemental lighting, the gains from spectrum optimization are usually smaller than the gains from getting DLI, uniformity, and environmental controls right.
Practitioners on LinkedIn horticulture groups have noted that growers who chase niche spectra (heavy red/blue ratios, specific far red percentages) before nailing their DLI targets and environmental coordination often see disappointing results. The spectrum conversation matters most once the fundamentals are locked in.
For a deeper dive into how spectrum interacts with plant growth, see this summary of light spectra effects.
Heating, Cooling, and Dehumidification
This is where many ROI calculations go wrong. In a greenhouse, heat is not automatically waste. It is either a cost, a benefit, or a control problem, depending on climate and season.
A peer reviewed Applied Energy study modeled greenhouse transitions from HPS to LED and found that LED conversion reduced lighting energy by 40% but increased heating energy by 9 to 49%. Total greenhouse energy savings came in at 10 to 25%, depending on conditions. That is a net win, but a smaller win than the lighting only numbers suggest.
A key tradeoff is the heat profile. In colder regions, HPS heat can be valuable during overnight supplemental lighting runs in winter. Conversely, in warm climates or sealed cannabis rooms, HPS heat creates cooling load that adds cost.
Some operators report needing more dehumidification, airflow, and environmental precision after switching from HPS, because the reduced heat changes the moisture dynamics of the growing space.
For a deeper understanding of how heat affects HVAC sizing, see this breakdown on cooling requirements for LED lights.
Power Architecture and HVAC Impact
The way fixtures receive power is an overlooked variable in greenhouse lighting ROI. Traditional installations run individual drivers inside each fixture, placing hundreds or thousands of heat generating components directly in the growing space. This adds to the HVAC cooling load, complicates electrical runs, increases potential failure points, and drives up installation labor.
Centralized or remote driver architectures move the driver components outside the grow space. The result is less heat at the canopy, simpler wiring, and fewer components that can fail in a humid, chemically active environment. For large deployments (200+ fixtures), the installation cost savings alone can shift payback by 6 to 12 months.
Practitioners on YouTube walkthroughs of commercial greenhouse builds have noted that conduit and electrical labor often represent 30% to 40% of total lighting project cost, and that remote power systems can cut that portion significantly. The OptiDrive remote power platform is one example of this approach, moving LED drivers out of the grow area to reduce in canopy heat and simplify long term serviceability.
For a full breakdown of how power distribution affects greenhouse projects, see this horticulture lighting power distribution guide.
CO₂ and Environmental Controls
Supplemental lighting can be wasted if other growth factors are limiting. Verify delivered light levels in your greenhouse and confirm that CO₂ is not the bottleneck for photosynthesis. If CO₂ is insufficient, added light may not translate into yield and can reduce project ROI.
More light does not guarantee more yield if CO₂, humidity, temperature, airflow, nutrition, or irrigation are limiting. The Energy Trust literature review makes the same point: increasing light interception raises plant water use, transpiration, CO₂ need, cooling, dehumidification, nutrition, and air movement requirements. Every one of those has a cost.
For more on managing this variable, read about the role of CO₂ in CEA.
Lighting Controls and Dimming
The ability to dim fixtures and integrate them with greenhouse climate controls is an increasingly important ROI variable. Without dimming, supplemental lights run at full power regardless of how much sunlight is already hitting the crop, which wastes electricity and delivers more photons than the crop can use during sunny periods.
Modern LED fixtures with 0 to 10V or MODBUS dimming can respond to real time light sensor data. When a cloud clears and natural DLI spikes, fixtures dim or shut off. When overcast conditions return, they ramp back up. This kind of dynamic supplemental lighting can reduce annual electricity use by 15% to 30% compared to fixed output operation, depending on location and season.
Time of use electricity pricing adds another dimension. Growers in regions with peak pricing can schedule lighting runs during off peak hours and dim or shut off during expensive windows, capturing meaningful cost savings without reducing total daily photon delivery.
Practitioners on Reddit’s controlled environment agriculture forums report that the payback on adding a light sensor and dimming controller to an existing LED system is often under one year, making it one of the highest ROI upgrades available to growers who already have dimmable fixtures but are running them at fixed output.
The bottom line: fixtures without dimming capability leave money on the table. Any greenhouse lighting ROI calculation should include the expected savings from dynamic light control versus always on operation.
Light Uniformity and Canopy Delivery
Many ROI calculators compare fixture wattage, but poor light distribution can lower crop value even if energy savings look great on paper.
Greenhouse Management reported that a grant funded LED installation in an indoor lettuce grow room boosted yields by 50% in a space previously hurt by shadows and uneven coverage. In the same article, a New England tomato grower reported that LED and HPS yields were close in his greenhouse, but HPS had a cost and heat advantage in his specific case.
A practical insight: fine tuning spectrum may not deliver the same commercial return as achieving even canopy coverage with well designed fixtures. For most commercial operations, uniformity and distribution matter more than spectrum hype.
ROI should be calculated on usable delivered light at the canopy, not theoretical fixture output.
Greenhouse Lighting ROI by Crop Type
Not all crops respond equally to supplemental lighting. Crop value and light response significantly influence payback.
Crop | Typical ROI Potential |
|---|---|
Tomatoes | Very High |
Strawberries | Very High |
Cannabis | Very High |
Lettuce | Moderate to High |
Herbs | Moderate |
Ornamentals | Moderate |
Propagation | Moderate to High |
High value crops typically generate greater revenue from each additional mole of light, making lighting investments easier to justify. For greenhouse top lighting projects serving cannabis or high light crops, the Altus 1K is designed for commercial supplemental lighting at scale.
Budgeting for an LED Retrofit
Fixture cost is only one component of a greenhouse LED retrofit budget. Growers who budget based on fixture price per unit consistently underestimate total project cost, and that makes their ROI projections look better than reality.
A realistic retrofit budget should include:
Fixtures: The largest line item, but typically 40% to 60% of total project cost depending on facility complexity.
Electrical infrastructure: Conduit, wiring, breaker panels, and potentially transformer or service upgrades. Older greenhouses running HPS on magnetic ballasts may need significant electrical work to support LED driver loads and control wiring.
Installation labor: Mechanical mounting, electrical connections, and control integration. Greenhouse installs often require lift equipment and work around active crops.
Controls and sensors: Light sensors, dimming controllers, and integration with greenhouse climate computers. These components pay for themselves through energy savings but must be budgeted upfront.
Engineering and design: A professional lighting plan showing fixture placement, expected PPFD at canopy, and uniformity mapping. Skipping this step is the single most common source of disappointing results.
Permit and inspection fees: Required in most jurisdictions for electrical work of this scale.
Contingency: Budget 10% to 15% for unforeseen issues. Older facilities frequently reveal wiring problems, structural limitations, or environmental control gaps during installation.
For a detailed breakdown of installation cost components, that guide covers what to expect at each stage.
A rule of thumb from commercial greenhouse operators: if the quoted fixture cost is X, plan for total installed project cost of 1.5X to 2.5X depending on facility age and electrical condition. Projects that involve remote driver systems or major electrical upgrades will be at the higher end, but may deliver faster payback through reduced HVAC load and lower ongoing maintenance.
Life Cycle Cost Analysis
Simple payback and ROI percentage are useful, but they do not capture everything. A life cycle cost analysis (LCCA) compares the total cost of owning and operating a lighting system over its entire useful life, typically 10 to 15 years for LED fixtures.
LCCA includes:
Initial capital cost (net of rebates)
Annual energy cost (adjusted for expected electricity rate increases, typically 2% to 3% per year)
Maintenance and replacement costs (bulb changes for HPS, driver replacements for LED, cleaning, and labor)
HVAC impact (heating and cooling cost changes over the full analysis period)
Output degradation (HPS loses significant output before bulb failure; LED output declines more gradually, with DLC requiring Q90 at 36,000 hours)
Disposal and decommissioning costs (HPS bulbs contain mercury and require hazardous waste handling in many jurisdictions)
Residual value (LED fixtures with remaining useful life at the end of the analysis period)
The key insight from life cycle analysis is that cheaper upfront systems often cost more over time. An HPS system with a $500 per fixture purchase price that requires $120 in annual bulb replacement, $80 in labor, and higher energy cost per photon delivered can easily exceed the lifetime cost of an LED system priced at $1,200 per fixture with minimal maintenance.
For operations evaluating fixtures across a 10 year window, the time value of money also matters. A net present value (NPV) calculation discounts future savings to today’s dollars, giving a more accurate picture of whether the investment creates value. Most commercial finance teams expect to see NPV analysis alongside simple payback for capital projects above $50,000.
Example: Energy Only LED Retrofit Payback
Here is a simplified example to show how the math works. This covers energy savings only. A real greenhouse lighting ROI analysis would add crop revenue, climate changes, maintenance, and rebates.
Scenario:
Existing system: 1000W HPS fixtures
Proposed: 600W LED fixtures delivering comparable useful photon output
Wattage saved: 400W per fixture
Operating schedule: 12 hours/day, 365 days/year = 4,380 hours/year
Electricity rate: $0.1341/kWh (close to the 2025 U.S. commercial average)
Fixture count: 100
Annual energy savings:
0.4 kW x 4,380 hours x $0.1341/kWh x 100 fixtures = approximately $23,500 per year
If net installed project cost after incentives is $120,000:
Simple payback = $120,000 / $23,500 = approximately 5.1 years from energy savings alone
Now consider the variables that shift this number:
If yield or crop quality improves, payback shortens.
If LEDs reduce cooling load in a warm climate, payback shortens.
If the greenhouse relied on HPS heat during winter, heating costs may rise and payback lengthens.
If the project qualifies for utility incentives, net upfront cost drops and payback shortens.
If utility demand charges apply, peak load reduction may matter more than kWh savings alone.
This example is energy only payback. Actual greenhouse lighting ROI can be better or worse depending on every variable discussed above.
LED vs HPS ROI in Greenhouses
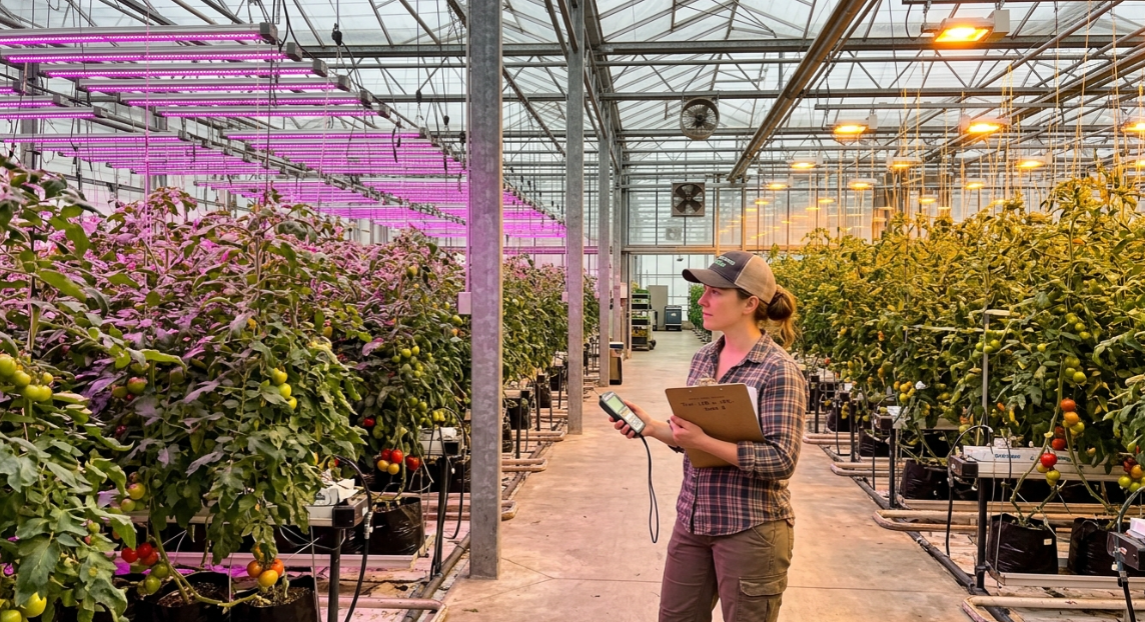
The honest answer: LED often wins, but not always. Here is how the two technologies compare across the factors that matter for greenhouse lighting ROI.
Factor | LED | HPS |
|---|---|---|
Upfront cost | Usually higher | Usually lower |
Energy efficiency (PPE) | Higher (3.0+ µmol/J) | Lower (1.0 to 1.7 µmol/J) |
Heat profile | Less radiant heat to crop | More radiant heat; can warm canopy |
Maintenance | Longer life, fewer lamp replacements | Bulb replacement and output decline |
Controls | Better dimming and automation | Less flexible |
Greenhouse winter heat | May require added heating | Can reduce heating need |
Warm climate cooling | Advantage LED | Disadvantage HPS |
LED ROI is strongest where lights run many hours, electricity is expensive, rebates are available, cooling load is high, or crop value increases with better light quality and uniformity.
HPS can still pencil out in cold climates where heat is valuable, in operations with constrained capital budgets, or where cheap electricity makes the efficiency gap less meaningful. A New England tomato grower told Greenhouse Management that his LED and HPS production were similar, while HPS provided useful heat and lower upfront cost.
Modern greenhouse operators increasingly treat lighting as part of an integrated control strategy, tying fixtures into automation, energy management, and data driven scheduling (including reacting to electricity pricing). Controls and automation are becoming part of the ROI equation, not just fixture specs. For a guide comparing greenhouse energy savings strategies, that resource covers the LED, HVAC, and rebate interaction in detail.
Common Mistakes When Calculating Greenhouse Lighting ROI
Calculating from watts alone. Watts tell you operating cost. PPE, PPFD, DLI, uniformity, and crop response tell you what that energy actually produces.
Ignoring heating and cooling effects. Switching from HPS to LED changes the thermal profile of the greenhouse. Model seasonal climate impact, or the ROI number will be wrong.
Treating greenhouse lighting like indoor sole source lighting. Greenhouses receive sunlight. The calculation must account for the DLI gap after greenhouse transmission losses, not a flat PPFD target.
Assuming every added photon produces profit. Michigan State University notes that supplemental lighting has little or no economic value for many crops once average DLI exceeds around 12 mol/m²/day, except for high light crops like tomatoes. There is a ceiling.
Assuming rebates after purchase. Many programs require preapproval, DLC listed fixtures, and trade ally involvement. Confirm eligibility before procurement.
Ignoring light uniformity. Shadows, hot spots, and uneven coverage create crop variation that costs money. Require a lighting plan and measure light at canopy level.
Forgetting environmental cascading effects. More light increases water use, transpiration, CO₂ demand, and dehumidification needs. If those systems cannot keep up, the added light creates stress rather than growth.
Skipping the life cycle view. Simple payback ignores bulb replacement cycles, output degradation, escalating energy costs, and disposal. A 3 year payback on HPS can look worse than a 4 year payback on LED when viewed over 10 years.
Budgeting only for fixtures. Installation, electrical infrastructure, controls, and engineering can add 50% to 150% on top of fixture cost. Underbudgeting the project means overestimating the ROI.
What Information Do You Need Before Calculating ROI?
Before running any greenhouse lighting ROI analysis, gather these inputs:
Current fixture type, wattage, age, and condition
Current fixture count and layout
Measured PPFD and uniformity at canopy level (not just nameplate specs)
Crop target DLI by growth stage and season
Actual in greenhouse DLI by month
Operating hours by season
Your electricity rate, including demand charges and time of use pricing
Heating and cooling costs by season
CO₂ supplementation strategy
Humidity and dehumidification capacity
Crop price, yield, grade out, shrink, and crop turn assumptions
Maintenance history and bulb replacement costs
Rebate eligibility and application timeline
Installed project cost (not just fixture cost)
Expected fixture life, warranty, and service support
A light plan showing delivered photons and uniformity across the canopy
Purdue’s framework says it plainly: cost benefit analysis should compare the cost of light against the added crop value. CropKing’s advice is equally direct: measure your greenhouse light levels and avoid simply “throwing up” fixtures based on sales promises.
Key Takeaways
Greenhouse lighting ROI measures payback from energy savings, incentives, maintenance savings, crop gains, and climate effects.
The best starting point is the crop’s DLI gap, not fixture wattage.
LEDs often improve energy efficiency, controllability, and maintenance cost, but HPS heat can still have value in cold climate greenhouses.
Rebates can shorten payback, but eligibility should be confirmed before purchase.
More light only creates ROI if CO₂, temperature, humidity, airflow, nutrition, and irrigation support the added growth.
A real ROI calculation requires measured canopy light levels and a facility specific lighting plan.
Life cycle cost analysis over 10+ years gives a more accurate picture than simple payback alone.
Dimming and lighting controls can reduce operating costs by 15% to 30% and should be included in every ROI model.
Budget for the full installed project cost, not just fixtures, to avoid overestimating returns.
Related Terms
DLI (Daily Light Integral): Total photosynthetic light received per square meter in a day, measured in mol/m²/day. The core metric for determining how much supplemental light a greenhouse needs.
PPFD (Photosynthetic Photon Flux Density): Light intensity at canopy level, measured in µmol/m²/s. Think of it as the “speed” of light delivery, while DLI is the “total volume.”
PPF (Photosynthetic Photon Flux): Total photon output from a fixture, measured in µmol/s. This tells you what the fixture produces, not what reaches the crop.
PPE (Photosynthetic Photon Efficacy): Fixture efficiency in µmol/J. Higher PPE means more photons per watt of electricity. The DLC minimum is 2.30 µmol/J.
TCO (Total Cost of Ownership): All costs over the life of the lighting system, including purchase, installation, energy, maintenance, replacement, and disposal.
Simple Payback: The time required for cumulative savings and benefits to recover the project cost. Usually expressed in months or years.
Payback Factor: The inverse of simple payback, expressing annual savings as a fraction of project cost. Useful for quick screening of multiple project options.
DLC Listed: A fixture listed under the DesignLights Consortium’s horticultural requirements. Often tied to utility rebate eligibility.
Light Uniformity: Evenness of delivered light across the canopy. Poor uniformity creates crop variation, waste, and lower average quality.
Supplemental Lighting: Electric lighting used to add to sunlight in a greenhouse during low light periods.
Sole Source Lighting: Electric lighting used as the primary or only light source, typical of indoor grows and vertical farms.
LCCA (Life Cycle Cost Analysis): A method for comparing the total cost of ownership across competing options over the full useful life of the system, including capital, operating, maintenance, and disposal costs.
FAQ
What is greenhouse lighting ROI?
Greenhouse lighting ROI is the financial return from a greenhouse lighting investment after accounting for system cost, installation, electricity, incentives, maintenance, climate control effects, and crop revenue impact. It is usually expressed as a percentage or a payback period in years.
How do you calculate greenhouse lighting ROI step by step?
Start by measuring your DLI gap, then size the lighting system to fill it. Calculate annual energy cost, estimate crop revenue impact, add maintenance and climate savings, apply confirmed rebates, and divide net project cost by total annual benefit for simple payback. Run a sensitivity test at higher electricity rates and lower crop prices to stress test the result.
What is a good payback period for greenhouse lighting?
There is no universal number. A good payback depends on electricity rate, crop value, operating hours, rebates, DLI gap, installation cost, and climate. Some projects pay back in two to three years with rebates and high electricity rates. Others take five to seven years on energy savings alone. Crop revenue impact can accelerate payback significantly for high value crops.
Does LED greenhouse lighting always have better ROI than HPS?
No. LEDs often have better energy efficiency and longer maintenance intervals, but HPS may still make financial sense in cold climates, cheap power regions, or facilities that benefit from HPS radiant heat. LED ROI is strongest where lights run many hours, electricity is expensive, rebates are available, or cooling load is high.
Why does DLI matter for lighting ROI?
DLI measures the total daily light received by the crop. Since greenhouses already receive sunlight, supplemental lighting ROI depends on how much extra DLI is needed to hit the crop target during low light periods. Without knowing the DLI gap, growers cannot determine how much supplemental light (and electricity) they actually need.
Should rebates be included in lighting ROI?
Yes, but only after confirming eligibility. Rebates reduce net project cost and can shorten payback considerably. Many programs require DLC listed fixtures, preapproval, trade ally involvement, or specific documentation. Plan for rebates early in the project, not after purchase.
How do dimming controls affect greenhouse lighting ROI?
Dimming allows fixtures to respond to real time sunlight levels, reducing electricity consumption during bright periods. Dynamic supplemental lighting with dimming and light sensors can reduce annual energy use by 15% to 30% compared to fixed output operation. The payback on adding controls to an existing dimmable system is often under one year.
What is the difference between simple payback and life cycle cost analysis?
Simple payback tells you when cumulative savings equal project cost. Life cycle cost analysis compares total ownership costs (capital, energy, maintenance, HVAC, disposal) over the full useful life of the system, typically 10 to 15 years. LCCA often reveals that cheaper upfront systems cost more over time due to higher energy use, bulb replacements, and output degradation.
Can adding more light actually reduce ROI?
Yes. More light can be wasted if the crop is already light saturated or if CO₂, humidity, temperature, airflow, irrigation, or nutrition are limiting. In some cases, extra lighting increases dehumidification, cooling, or labor costs without proportional yield gains.
How do I get a facility specific greenhouse lighting ROI estimate?
Start by measuring your current in greenhouse DLI, documenting your electricity rate and operating schedule, and identifying your crop’s target DLI by season. Then work with a lighting provider who can model delivered photons, uniformity, energy cost, and climate impacts for your specific facility.
Request a greenhouse lighting consultation to discuss your facility specific variables before committing capital.