Greenhouse Lighting Design: 2026 Complete DLI & PPFD Guide
Learn greenhouse lighting design for 2026: calculate DLI and PPFD, plan fixture layouts, select spectra, and reduce energy costs. Read the guide.
TL;DR
Greenhouse lighting design is the process of calculating how much supplemental artificial light your crops need beyond what the sun provides, then specifying the right fixtures, spectrum, layout, controls, and electrical infrastructure to deliver it. The workflow starts with assessing natural light (measured as DLI), applying your greenhouse’s real world transmission losses, calculating the deficit, and converting that deficit into a fixture plan with verified uniformity. Getting this right means higher winter yields, consistent crop quality year round, and energy costs that actually make economic sense.
Greenhouses exist to capture sunlight. So why would anyone spend money on electric lights inside one?
The answer comes down to math. At northern latitudes in January, outdoor daily light levels can drop below 10 mol/m²/day. Tomatoes need 20 to 35. Cannabis needs 30 to 40 or more. Even lettuce, a relatively low light crop, wants 12 to 17. Without supplemental lighting, winter production stalls, quality drops, and revenue follows.
Greenhouse lighting design sits at the intersection of plant science, electrical engineering, and economics. It is the discipline of figuring out exactly how much artificial light to add, where to put it, what spectrum to use, how to control it, and how to pay for it without destroying your operating margins.
This guide covers every term, metric, and design step you will encounter in a greenhouse lighting project, from first principles through commissioning and ROI analysis.
Explore greenhouse lighting solutions to see how these principles translate into real projects.
Quick Answer: How Do You Design Greenhouse Lighting?
Greenhouse lighting design starts by calculating your crop’s Daily Light Integral (DLI) target, measuring how much natural light reaches the canopy, determining the DLI deficit, and then selecting LED fixtures that provide the required supplemental PPFD over the desired photoperiod.
A successful greenhouse lighting design typically follows these steps:
- Measure outdoor DLI for your location.
- Apply the greenhouse transmission factor.
- Calculate the crop’s DLI deficit.
- Convert the deficit into required PPFD.
- Select spectrum and efficient LED fixtures.
- Estimate fixture count and create a photometric layout.
- Verify light uniformity with PPFD mapping.
- Automate lighting with DLI based controls.
- Document the design and calculate ROI.
The goal is to provide enough supplemental light to maximize yield while minimizing electricity costs.
Core Metrics Every Grower Must Know
Before talking about fixtures or layouts, you need a shared vocabulary. These are the metrics that drive every greenhouse lighting design decision. For a deeper reference, the research grow lights glossary covers additional terms and benchmarks.
PAR (Photosynthetically Active Radiation)
PAR is the band of light wavelengths plants actually use for photosynthesis, spanning 400 to 700 nanometers. This is “usable light” from the plant’s perspective. Lumens and lux measure brightness as the human eye perceives it, which is largely irrelevant for growing. A fixture that looks blindingly bright to you might deliver mediocre PAR. Always evaluate plant lighting in PAR based units.
PPFD (Photosynthetic Photon Flux Density)
PPFD measures the number of photosynthetically useful photons hitting a specific point at a specific moment, expressed as µmol/m²/s. Think of it as a snapshot of light intensity at the canopy.
Benchmark ranges vary by crop type. Leafy greens generally need 200 to 400 PPFD. Fruiting plants like tomatoes and peppers need 600 or more. Cannabis flower rooms commonly run 700 to 900 µmol/m²/s at ambient CO₂, and 900 to 1,100+ µmol/m²/s when CO₂ is supplemented.
DLI (Daily Light Integral)
If PPFD is a snapshot, DLI is the full movie. DLI measures how many usable photons reach the plant over the course of an entire day, expressed in mol/m²/day. This is the number that actually drives crop outcomes, because plants respond to total daily light, not instantaneous intensity.
A widely cited rule of thumb in extension literature: one percent increase in light equates to roughly one percent increase in plant growth.
The DLI to PPFD Conversion Formula
This equation is the backbone of every supplemental lighting calculation:
DLI (mol/m²/day) = PPFD (µmol/m²/s) × Photoperiod (hours) × 3,600 / 1,000,000
To work it backwards (which is what you do during design), you solve for the PPFD your fixtures need to deliver:
PPFD = (DLI × 1,000,000) / (Photoperiod in hours × 3,600)
A quick example: if you need to supplement 5 mol/m²/day over a 16 hour photoperiod, the required PPFD from your lights is about 87 µmol/m²/s. That is surprisingly modest, which is why the calculations matter. Guessing leads to oversizing or undersizing. A full walkthrough of DLI greenhouse calculations goes deeper on this formula and its practical application.
PPF (Photosynthetic Photon Flux)
PPF is the total light output from a fixture, measured in µmol/s. Unlike PPFD, it does not account for where the light lands. It is the fixture’s raw output, useful for comparing one fixture to another but not sufficient for design on its own.
PPE (Photosynthetic Photon Efficacy)
PPE tells you how efficiently a fixture converts electricity into usable plant photons, expressed as µmol/J (micromoles per joule). This is the single most important efficiency spec when comparing fixtures.
For 2025 and 2026, growers should look for a PPE rating of 2.8 µmol/J or higher. The best commercial LED fixtures are now surpassing 3.0 µmol/J. For comparison, HPS lights typically deliver around 1.7 to 2.0 µmol/J. The horticulture lighting facts label provides a standardized framework for evaluating fixture performance.
Greenhouse Lighting Design at a Glance
| Design Step | Purpose | Output |
|---|---|---|
| Determine crop DLI target | Know crop light requirements | Target mol/m²/day |
| Measure outdoor DLI | Calculate available sunlight | Outdoor DLI |
| Apply greenhouse transmission | Estimate canopy light | Indoor DLI |
| Calculate DLI deficit | Determine supplemental light needed | Required DLI |
| Convert DLI to PPFD | Size lighting system | Required PPFD |
| Select spectrum and fixtures | Choose LEDs and spectrum profile | Fixture count and type |
| Create photometric layout | Plan fixture spacing and mounting | Layout drawing |
| Validate with PPFD map | Confirm installation | Uniform canopy |
| Document and calculate ROI | Justify investment | Payback timeline |
Understanding Your Natural Light Budget
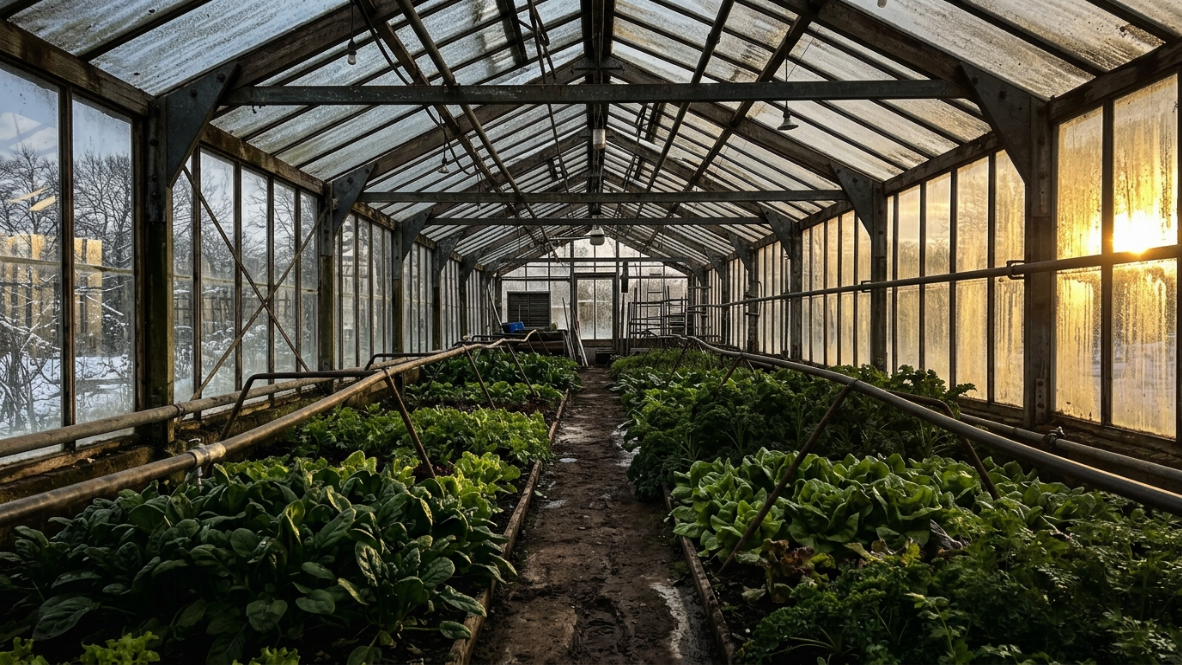
A greenhouse lighting design that ignores the sun is not a design. It is a guess. The first job is figuring out how much free light you are actually getting.
Latitude and Season
The same crop in Arizona and Michigan can have identical DLI targets. But the outdoor DLI available in a Michigan winter is not even close to Arizona’s. Outdoor winter DLI in the northern United States can drop to 10 to 15 mol/m²/day, while summer values in the same location might exceed 50. Tools like NOAA solar radiation maps or SunTracker Technologies provide monthly outdoor DLI data for specific locations.
Glazing Transmission: Lab Numbers vs. Reality
This is where most designs go wrong. Growers look up the transmittance spec for their glazing material and plug it straight into their calculations. Single pane clear glass, for instance, is typically rated at 88 to 91 percent transmittance in laboratory conditions. That sounds great. It is also misleading.
If you actually measure PAR at the leaf canopy inside a greenhouse, it is often only 40 to 60 percent of outdoor levels. A double polyethylene greenhouse tested by University of Arkansas extension research showed only 45 percent of outside light reaching the crop plane.
The gap comes from sun angle changes throughout the day and year, structural members casting shadows, condensation on glazing surfaces, dirt and algae buildup, shade screens, and equipment mounted overhead. Your greenhouse light transmission factor is the operational number that matters: the real, measured percentage of outdoor light that reaches your crops after everything takes its toll.
Structural Shadow Mitigation
Structure is the silent killer of greenhouse light transmission. Gutters, trusses, hanging baskets, HVAC ductwork, and the fixtures themselves all cast shadows that compound throughout the day. A single overhead beam might block only 3% of light at noon, but at low winter sun angles that same beam can shade 10% or more of the crop area.
Practical mitigation strategies include painting structural steel white or using reflective tape to redirect stray photons, orienting ridge lines east to west so that shadows track across crops rather than sitting on them all day, choosing slim profile LED fixtures specifically because their narrow cross section blocks less sunlight than bulky HPS reflectors, and routing conduit and piping along existing structural members rather than creating new shadow lines. Practitioners on Reddit report that many growers overlook the cumulative impact of dozens of small shadow sources, and that even a 5% improvement in transmission can visibly change winter crop performance over a full season.
DLI Targets by Crop
These targets appear consistently across university extension sources and industry guides. They are guidelines, not absolutes. Economics, CO₂ supplementation levels, and cultivar specific responses all shift the optimum.
| Crop | Target DLI (mol/m²/day) |
|---|---|
| Microgreens | 6 to 12 |
| Lettuce and leafy greens | 12 to 17 |
| Herbs | 12 to 18 |
| Ornamentals | 9 to 13 |
| Strawberries | 15 to 20 |
| Peppers and cucumbers | 20 to 30 |
| Tomatoes | 20 to 35 |
| Cannabis | 30 to 40+ |
The pattern is straightforward: fruiting crops require dramatically more light than leafy crops. Producing fruit demands significantly more energy than growing leaves. The DLI for fruiting crops can be double or triple that of some leafy greens. Crop specific guides for peppers and cucumbers cover the nuances in more detail.
The Supplemental Lighting Design Workflow
Here is the step by step process that connects your crop’s light needs to an actual fixture plan.
Step 1: Assess Natural Light Availability
Pull monthly average outdoor DLI data for your specific location. Focus on the worst months (typically December through February in the Northern Hemisphere), because that is when the supplemental lighting system earns its keep. You are designing for the deficit, and the deficit is largest in winter.
Step 2: Apply Your Greenhouse Transmission Factor
Multiply outdoor DLI by your real world transmission factor. If outdoor DLI in January is 12 mol/m²/day and your greenhouse transmission factor is 55%, the light reaching your crops is about 6.6 mol/m²/day.
Do not use the glazing manufacturer’s lab transmittance. Use a measured or conservatively estimated operational number that accounts for structure, screens, equipment, and soiling. A common planning range is 40 to 70 percent depending on greenhouse type and maintenance.
Step 3: Calculate the DLI Deficit
This is simple subtraction. If your lettuce needs 15 mol/m²/day and you are getting 6.6 mol/m²/day inside the greenhouse, the deficit is 8.4 mol/m²/day. That is what your supplemental lighting system must deliver. A complete guide to how much supplemental lighting a greenhouse needs walks through this calculation for multiple scenarios.
Step 4: Convert the Deficit to Required PPFD
Now choose a photoperiod. Most greenhouses run 14 to 20 hours of supplemental lighting per day, depending on natural sunlight levels and crop type. Photoperiod sensitive crops like cannabis have hard constraints (12 hours light / 12 hours dark triggers flowering).
Using our lettuce example with a 16 hour supplemental photoperiod:
PPFD = (8.4 × 1,000,000) / (16 × 3,600) = approximately 146 µmol/m²/s
That is the average PPFD your fixtures need to deliver at the canopy.
There is a tradeoff worth noting here. Longer hours at lower PPFD can reduce the number of fixtures needed, but may push runtime into expensive peak rate tariff windows. Concentrated high PPFD in fewer hours can raise peak kilowatt demand charges. The right answer depends on your utility rate structure.
Step 5: Select Spectrum and Fixtures
Fixture selection now involves two related decisions: the spectrum profile and the hardware itself.
Spectrum selection determines which wavelengths your fixtures emit. This is not cosmetic. Different wavelengths drive different plant responses. Red light (around 660 nm) is the most photosynthetically efficient wavelength and drives biomass accumulation. Blue light (around 450 nm) influences morphology, keeping plants compact and regulating stomatal opening. Green light (500 to 565 nm) penetrates deeper into the canopy than red or blue, reaching lower leaves that would otherwise be light starved. White LEDs (which combine a blue chip with a broad spectrum phosphor) deliver a mix of all three, plus far red, in ratios that depend on the phosphor chemistry.
The practical question for most greenhouse growers is whether to choose a fixed spectrum or an adjustable (tunable) spectrum fixture. Fixed spectrum fixtures lock in a specific ratio of red, blue, and white at the factory. They are simpler, cheaper per watt, and more reliable because there are fewer components. For the vast majority of greenhouse supplemental lighting applications, a well designed fixed spectrum that produces full spectrum white light is the right call. It covers the photosynthetic action spectrum effectively, and the work environment is dramatically better than under “pink” or “purple” fixtures that combine only red and blue LEDs.
Adjustable spectrum fixtures let growers dial wavelength ratios up or down. The pitch is compelling: shift toward blue during veg for compact growth, shift toward red during flower for maximum yield. In practice, tunable spectrum adds cost, complexity, and additional failure points. Research institutions and breeding programs benefit from this flexibility. Most commercial greenhouse operations do not need it and are better served by a fixed, high efficacy white spectrum. A deeper dive into light spectra and plant growth covers the science behind these tradeoffs.
For the hardware itself, evaluate fixtures based on PPE (efficiency, target 2.8+ µmol/J), PPFD distribution maps, IP rating (greenhouses are wet and warm), shadow profile (slimmer is better), and compatibility with your control system. Simulation software helps engineers visualize and optimize lighting configurations before committing to a layout.
For greenhouse applications, slim profile fixtures are standard. The reason is simple: if you use large fixtures with wide reflector hoods, they block chunks of your canopy from natural sunlight. The fixtures you bought to enhance light end up defeating part of the purpose.
See greenhouse rated LED fixtures designed with slim profiles to minimize shadowing.
Step 6: Estimate Fixture Count and Create the Photometric Layout
With your required PPFD and your chosen fixture’s PPF known, you can estimate how many fixtures you need. The key variable connecting them is the utilization factor, which accounts for the percentage of a fixture’s total light output that actually reaches the target crop area. Not all photons land on plants. Some hit walls, floors, structural members, or neighboring fixtures. Utilization factors for greenhouse top lighting typically fall between 0.7 and 0.9 depending on mounting height, beam angle, and reflective surfaces.
The basic fixture count formula:
Number of fixtures = (Required PPFD × Growing area in m²) / (PPF per fixture × Utilization factor)
For example, if you need 150 µmol/m²/s across 1,000 m², using fixtures rated at 1,800 µmol/s PPF with a utilization factor of 0.85:
Number of fixtures = (150 × 1,000) / (1,800 × 0.85) = approximately 98 fixtures
This is a planning estimate. The actual number gets refined during the photometric layout stage.
Photometric layout is where the fixture count turns into a physical plan. Using manufacturer PPFD distribution data or lighting simulation software (AGi32, DIALux, or proprietary tools from fixture manufacturers), the designer places fixtures on a digital model of the greenhouse and runs simulations to predict PPFD at canopy level across the entire growing area.
Two variables dominate layout quality:
Mounting height determines how widely each fixture’s beam spreads before reaching the canopy. Higher mounting means wider coverage per fixture but lower peak intensity. Lower mounting concentrates light but creates more pronounced hotspots and requires more fixtures for uniformity. Most greenhouse supplemental lighting fixtures mount between 1.5 and 4 meters above the canopy, depending on fixture optics and the target uniformity ratio.
Fixture spacing is directly related to mounting height and beam angle. A common rule of thumb is that fixture spacing should be roughly 1.0 to 1.5 times the mounting height for fixtures with standard beam angles (90 to 120 degrees). Tighter spacing improves uniformity but increases fixture count and cost. The photometric simulation reveals the sweet spot for each specific project.
The output of this step is a layout drawing showing fixture positions, mounting heights, spacing dimensions, orientation, and predicted PPFD values at multiple points across the canopy. This drawing becomes a critical piece of the project documentation.
Step 7: Validate with PPFD Mapping
After installation, use a calibrated quantum sensor (Apogee or LI COR) to map PPFD across the growing area. This step catches layout problems, hanging height errors, and fixture performance issues before they cost you a crop cycle. Do not treat commissioning as paperwork. It is where LED retrofits succeed or fail.
Step 8: Implement Controls Strategy
A smart supplemental lighting strategy operates on a straightforward premise: only use electrical lighting to fill the gap between what the sun provides and what the crop demands. Research from Purdue University found that controlling lighting based on real time solar intensity reduced energy consumption by 30%.
DLI tracking controllers measure incoming sunlight continuously and dim or brighten fixtures automatically. This avoids both under lighting and wasting electricity on sunny afternoons.
Dimming control compatibility matters more than many buyers realize. Not all fixtures respond identically to 0 to 10V, DALI, or PWM dimming signals. Some fixtures flicker at low dimming percentages, and others have a minimum dimming threshold of 20 to 30 percent rather than dimming smoothly to zero. Verify dimming performance across the full range before committing to a fixture, especially if you plan sensor driven automation. Practitioners on greenhouse forums frequently report frustration when fixtures that dim perfectly in a demo room behave erratically once connected to a greenhouse climate computer.
Control system integration is the other half of this equation. Most commercial greenhouses run an environmental control computer (Priva, Hoogendoorn, Ridder, or similar). The lighting system needs to communicate with that controller, not operate as an island. Integration means the climate computer can coordinate lighting with shade screens, heating, ventilation, and CO₂ injection as a unified system. Insist on documented communication protocols (typically Modbus, BACnet, or proprietary APIs) and test integration before the first crop goes in.
Step 9: Document the Design and Calculate ROI
Professional greenhouse lighting design produces documentation, not just a box of fixtures. The minimum documentation package should include the photometric layout drawing with fixture positions and predicted PPFD values, the DLI deficit calculation showing how supplemental targets were derived, an electrical single line diagram showing panel schedules, circuit loading, and wire sizing, a controls specification describing sensor placement, dimming protocols, and integration with the climate computer, and a bill of materials listing every fixture, driver, sensor, and mounting component.
This documentation serves three purposes. It is required for utility rebate applications (more on this below). It protects the grower if performance disputes arise with the fixture supplier. And it becomes the reference baseline for future expansions or troubleshooting.
Power Density Estimation and Daily Energy Calculation
Before signing off on a lighting design, you need to understand the electrical load it creates. Two numbers matter.
Power density (watts per square meter) tells you how much electrical power the lighting system draws per unit of growing area. For greenhouse supplemental lighting, typical power densities range from 50 to 150 W/m² for leafy greens and 150 to 400 W/m² for high light crops like tomatoes or cannabis. Power density drives panel sizing, transformer capacity, and ultimately whether your existing electrical service can handle the load or needs an upgrade.
Daily energy consumption (kilowatt hours per day) is power density multiplied by growing area and daily runtime:
kWh/day = (Power density in W/m² × Growing area in m² × Daily runtime in hours) / 1,000
For a 2,000 m² greenhouse running 100 W/m² of supplemental lighting for 12 hours per day, that is 2,400 kWh/day. At $0.10 per kWh, that is $240 per day or roughly $7,200 per month. These numbers need to be on the table before construction starts, not after the first electricity bill arrives. A thorough guide to greenhouse energy savings covers strategies for managing these costs.
R Value Considerations
Here is a detail that catches cold climate greenhouse operators off guard. The R value (thermal resistance) of your glazing material affects lighting design indirectly but significantly. Higher R value glazing (double wall polycarbonate, triple pane glass, or insulated panels) retains more heat, which reduces heating costs. But it also transmits less light than single pane glass or single layer poly film.
A greenhouse built with R 3.0 twin wall polycarbonate might have excellent thermal performance but transmit only 50 to 60 percent of outdoor PAR. A single pane glass house at R 0.9 lets in more light but bleeds heat. The tradeoff between thermal efficiency and light transmission directly affects how much supplemental lighting you need and how much you spend on heating. Both factors must be modeled together.
Fixture Types and Selection Criteria
LED vs. HPS: The Full Picture
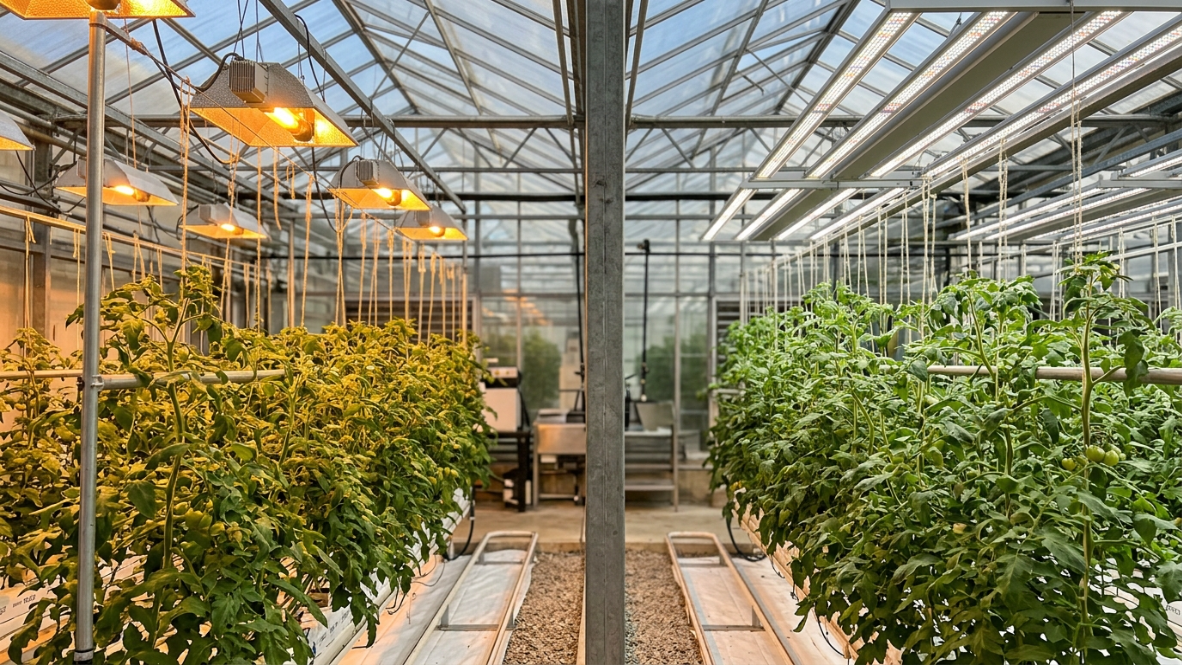
The efficiency gap is real and growing. A study from Wageningen University showed that LEDs use 44% less energy than HPS. The Greenhouse Energy Profile Study found LED grow lights use between 35 and 55 percent less electricity than HPS.
But the complete energy picture is more complicated than vendor brochures suggest. LEDs emit very little radiant heat compared to HPS. In cold climates, that “waste” heat from HPS fixtures offsets greenhouse heating costs. When you switch to LEDs, the heating system has to compensate. How much energy you actually save depends on your climate, heating fuel costs, and how your HVAC system responds. Understanding HVAC requirements for LED lights is essential for accurate total cost modeling.
The honest assessment: in warm climates and summer months, LEDs are a clear win on total energy. In cold climates during winter, the net savings are real but smaller than the electricity only numbers imply. Growers in northern regions should model total energy (lighting plus heating plus dehumidification) before assuming a specific payback period.
Key Specs to Compare
When evaluating fixtures for greenhouse lighting design, focus on:
- PPE (µmol/J): Higher is better. Target 2.8+ for current generation fixtures.
- PPFD distribution maps: Shows how light spreads. Look for wide, even coverage.
- IP rating: Greenhouses are wet, warm environments. UL listing and appropriate IP rated enclosures are not optional.
- Shadow profile: Slimmer is better in greenhouses where every percent of blocked sunlight costs yield.
- DLC listing: Required for utility rebate eligibility.
- Dimming range and protocol: Confirm compatibility with your control system before purchasing.
Recommended PPFD by Crop
| Crop | Recommended PPFD (µmol/m²/s) |
|---|---|
| Lettuce | 200 to 350 |
| Herbs | 250 to 400 |
| Microgreens | 150 to 250 |
| Strawberries | 400 to 600 |
| Cucumbers | 500 to 700 |
| Tomatoes | 600 to 900 |
| Cannabis Veg | 400 to 700 |
| Cannabis Flower | 700 to 1,100 |
Layout, Spacing, and Uniformity
Average PPFD gets most of the attention, but uniformity is where designs actually fail. A system that delivers 200 µmol/m²/s on average but ranges from 100 to 300 across the canopy will produce visibly uneven crops.
The Bullseye Effect
Nearly all greenhouse lighting layouts use regularly spaced planar arrays because they are simple to install. The drawback is predictable: PPFD tends to be higher at the canopy interior regions and lower at the edges and corners. USDA Agricultural Research Service studies have documented this “bullseye effect” and its impact on crop uniformity.
Commercial growers aim for 75 to 80 percent uniformity at canopy level as a minimum benchmark. A properly designed layout targets a uniformity ratio of 0.85 or higher, meaning the lowest PPFD reading is at least 85% of the highest.
Interlighting Strategy
For tall crops like tomatoes, peppers, cucumbers, and cannabis, light from overhead fixtures struggles to penetrate deep into the canopy. Lower leaves get insufficient PPFD and produce less. Interlighting (also called under canopy or intra canopy lighting) addresses this by placing supplemental fixtures within or below the crop canopy, directing photons to leaves that overhead fixtures cannot reach effectively.
The approach works because of basic physics. A dense tomato or cannabis canopy can absorb 80 to 90 percent of incoming light in the top 30 cm of foliage. Everything below is in deep shade. Interlighting bypasses the top canopy entirely. Research and commercial trials have shown yield improvements of 20 to 30 percent from interlighting, particularly in high wire vegetable production and cannabis cultivation. One project manager shared in a YouTube walkthrough that interlighting produced the biggest per watt yield gain of any single change in their greenhouse retrofit.
Interlighting fixtures are typically slim, low wattage bars (60 to 120W) with narrow beam angles designed to direct light horizontally into the canopy rather than downward. They mount on crop support wires or vertical trellis systems.
Learn about under canopy lighting and the fixture designs built specifically for this application.
The key design consideration is balancing top light and interlight intensity. Simply adding interlight without adjusting top light can push total DLI beyond what the crop can use efficiently, wasting energy. Most successful interlighting deployments allocate 20 to 30 percent of total fixture wattage to interlight positions, with the remainder overhead.
Power Distribution and Electrical Infrastructure
This is the most underserved topic in greenhouse lighting design, and it is where projects get expensive fast.
A large commercial greenhouse might have hundreds or thousands of individual fixtures, each with its own integrated LED driver, all operating in a warm, humid environment. Practitioners on the Mike Holt electrician’s forum have documented the challenges firsthand. One grower described a retrofit of approximately 4,000 HID lights to LED panels, struggling with conflicting information on whether fixtures were properly rated for damp greenhouse environments and facing enormous wiring complexity. A dedicated guide to greenhouse electrical infrastructure covers the terminology and code requirements in detail.
Centralized vs. Distributed Power
Traditional LED installations put a driver inside every fixture. That means thousands of electronic components operating in the worst possible environment: hot, humid air that corrodes connections and shortens component life.
An alternative approach moves drivers out of the grow space entirely. A centralized power architecture consolidates power conversion into rack mounted units in a clean, climate controlled electrical room. The fixtures themselves become simpler, lighter, and more reliable because the most failure prone component is no longer sitting above your crop in a tropical microclimate.
The benefits cascade: fewer in room failure points, simpler wiring runs, reduced HVAC load (drivers generate heat), easier maintenance access, and potentially lower installation costs because of reduced conduit requirements.
Controls and Automation
Good controls separate profitable greenhouse lighting from expensive greenhouse lighting.
Sensor Based Dimming
Outdoor PAR sensors feed real time data to a controller that adjusts fixture output inversely to sunlight. Bright afternoon? Lights dim or shut off. Cloudy morning? Lights ramp up. This is how Purdue’s research achieved that 30% energy reduction.
DLI Tracking Controllers
More advanced systems track accumulated DLI throughout the day and project whether the crop will hit its target by the end of the photoperiod. If a sunny morning delivers more photons than expected, the controller reduces afternoon supplemental hours. If clouds roll in, it extends them.
Scheduling Around Energy Costs
Many utilities charge different rates at different times of day, plus demand charges based on peak kilowatt draw. Smart scheduling shifts supplemental lighting hours toward off peak windows where possible, which can meaningfully reduce operating costs without changing total DLI delivered.
Blackout Curtains
For photoperiod sensitive crops, blackout curtains are part of the lighting design, not an afterthought. They allow precise control over the light/dark cycle regardless of season or latitude. A complete greenhouse photoperiod lighting guide covers the interaction between supplemental lighting and day length management.
Energy, Economics, and Rebates
LED Energy Savings
LED fixtures use 35 to 55 percent less electricity than HPS for the same PPFD output. Remember, though: total energy savings depend on heating requirements. In cold climates, model the complete system.
Utility Rebates and the DLC QPL
Here is where greenhouse lighting design projects can get significantly cheaper. Transitioning from legacy HPS to LED fixtures with available rebate programs can offset 30 to 70 percent of total fixture cost. In some cases, rebate programs have covered more than 60 percent of equipment costs.
The key gatekeeper for rebate eligibility in 2026 is the DesignLights Consortium (DLC) Horticultural Qualified Products List. DLC certification requires fixtures to meet minimum PPE thresholds, typically 2.3 to 2.7 µmol/J. If a fixture is not on the DLC Hort QPL, it will not qualify for most utility rebates. Learn more about why this matters in this overview of DLC listed LED grow lights.
USDA REAP Grants
The USDA’s Rural Energy for America Program (REAP) offers grants for up to 50% of project costs, with a maximum award of $500,000 per year. This is real money for commercial greenhouse operations and is underutilized.
The Pre Approval Rule
Many growers lose tens of thousands of dollars by ordering fixtures before their rebate application is approved. Always get written approval from your utility before purchasing equipment. This is not a suggestion. It is the most common and most expensive mistake in the rebate process.
ROI Analysis and Payback Calculation
A greenhouse lighting project is a capital investment, and it should be evaluated like one. The ROI analysis needs to account for both costs and revenue impacts, not just energy savings.
Building the ROI Model
The inputs are straightforward but must be realistic:
Capital costs: Fixtures, mounting hardware, wiring, electrical panel upgrades, controls, sensors, installation labor, engineering and design fees, and commissioning. Subtract any rebates or grants received.
Annual operating costs: Electricity for lighting (use the daily energy calculation from above, extended across the months the system operates), incremental heating costs if switching from HPS (LEDs produce less heat, so the boiler or HVAC runs more), maintenance and lamp replacement (minimal for LEDs, significant for HPS), and any control system subscription fees.
Annual revenue impact: This is the number most growers underestimate. Supplemental lighting changes three things: it increases yield per square meter during low light months, it improves crop quality and consistency (which often commands a price premium), and it can extend the growing season or add crop cycles per year.
Payback Calculation
The basic payback formula:
Payback (years) = Net capital cost / Annual net benefit
Where net capital cost is total installed cost minus rebates, and annual net benefit is additional revenue plus energy savings (versus HPS) minus incremental operating costs.
A worked example: A 5,000 m² greenhouse installs LED supplemental lighting at a total cost of $400,000. Utility rebates cover $160,000, bringing net capital cost to $240,000. The system saves $45,000 per year in electricity versus the old HPS system, but adds $8,000 per year in heating costs. Winter yield increases by 25%, adding $120,000 in annual revenue. Net annual benefit: $45,000 + $120,000 minus $8,000 = $157,000. Payback: approximately 1.5 years.
That payback will vary enormously depending on crop value, electricity rates, climate, and rebate availability. Cannabis operations typically see faster payback than vegetable greenhouses because of higher crop value per square foot. But even lower value crops can pencil out when rebates cover a large portion of capital cost.
The critical mistake in ROI analysis is modeling only the energy savings and ignoring the yield and quality gains. For most greenhouse operations, the revenue side of the equation matters more than the energy side.
Working with a Professional Lighting Designer
For any greenhouse over about 1,000 m², professional lighting design pays for itself. The cost of engineering (typically 3 to 8 percent of project cost) is trivial compared to the cost of a poorly designed system that undersizes light for winter, oversizes electrical infrastructure, fails to meet rebate documentation requirements, or delivers uneven PPFD that produces inconsistent crops.
A professional design delivers the complete documentation package described above, a simulation validated photometric layout, electrical specifications that your contractor can bid and build from, and rebate application support. Many fixture manufacturers offer this service as part of the sales process, though the quality and independence of that design work varies.
Schedule a free consultation with a lighting expert to walk through your facility’s specific DLI deficit, layout options, and rebate eligibility.
Common Greenhouse Lighting Design Mistakes
Using lab transmittance numbers instead of real world transmission factors. Your glass might be rated at 90% transmittance. Your plants are getting 50%. Design for reality.
Oversizing for peak PPFD without considering photoperiod optimization. You may not need massive fixtures if you can extend photoperiod by a few hours. Do the DLI math before specifying wattage.
Ignoring fixture shadowing. Bulky HPS reflectors or oversized LED fixtures block natural sunlight. In a greenhouse, every blocked photon is a photon you paid for with the building but are not using.
Skipping PPFD mapping after installation. The design model and the installed reality always differ. Mapping catches problems before they become crop losses. A real world greenhouse case study illustrates the difference tight design to install accuracy can make.
Buying fixtures before securing rebate pre approval. This one costs growers tens of thousands of dollars every year. Get the approval in writing first.
Treating an LED retrofit as a one for one HPS swap. LEDs produce less heat. Your climate control strategy (heating, dehumidification, airflow) needs to change too. An LED retrofit without HVAC adjustments creates new problems while solving old ones.
Ignoring light uniformity. Average PPFD numbers mean little if some zones are getting 50% more light than others. Uneven light means uneven growth, uneven ripening, and uneven revenue.
Skipping the ROI analysis. Installing lighting “because everyone else does” without modeling the actual payback is how operations end up with systems they cannot justify economically. Run the numbers first.
Neglecting dimming compatibility testing. A fixture that claims 0 to 100% dimming but flickers below 30% is functionally a fixture with 30 to 100% dimming. Test before you buy.
Frequently Asked Questions
How do I calculate how much supplemental light my greenhouse needs?
Start by finding your location’s average monthly outdoor DLI (NOAA solar maps or similar tools). Multiply by your greenhouse’s real world transmission factor (typically 40 to 70%). Subtract the result from your crop’s target DLI. The difference is your supplemental lighting requirement. Convert that DLI deficit to PPFD using the formula: PPFD = (DLI × 1,000,000) / (Photoperiod in hours × 3,600).
Why are lumens and lux not used in greenhouse lighting design?
Lumens and lux measure light as perceived by the human eye, which is most sensitive to green and yellow wavelengths. Plants use a different spectrum for photosynthesis (400 to 700 nm, weighted differently than human vision). PAR, PPFD, and DLI measure light in terms that are relevant to plant growth. Using lumens for plant lighting is like measuring temperature with a ruler.
What PPE should I look for in a greenhouse LED fixture?
For fixtures purchased in 2025 or 2026, target a PPE of 2.8 µmol/J or higher. The best commercial LEDs now exceed 3.0 µmol/J. DLC certification, which is required for most utility rebates, sets minimum PPE thresholds between 2.3 and 2.7 µmol/J depending on fixture type.
Do I still need supplemental lighting if I have a glass greenhouse?
Almost certainly, at least during winter months. Even high transmittance glass greenhouses lose 40 to 60 percent of outdoor light by the time it reaches the canopy. At higher latitudes, winter outdoor DLI is low enough that most crops will underperform without supplemental light, regardless of glazing quality.
Are HPS lights still a reasonable choice for greenhouses?
In some cases, yes. While LEDs are 35 to 55 percent more efficient in electricity consumption, HPS fixtures produce significant radiant heat. In cold climate greenhouses where heating costs are substantial, that “waste” heat offsets part of the heating bill. The right comparison is total energy cost (lighting plus heating plus dehumidification), not just the electric bill for the lights.
How much can rebates reduce the cost of a greenhouse LED retrofit?
Utility rebate programs routinely cover 30 to 70 percent of fixture costs for qualifying LED upgrades. The USDA REAP program can grant up to 50 percent of project costs (maximum $500,000 per year). The critical requirement is that fixtures must be on the DLC Horticultural Qualified Products List, and you must receive written pre approval before purchasing equipment.
What is a good PPFD uniformity target for greenhouse lighting?
Commercial growers typically aim for a uniformity ratio of 0.85 or higher, meaning the lowest PPFD reading across the canopy is at least 85% of the highest. As a general benchmark, 75 to 80 percent uniformity at canopy level is considered the minimum acceptable standard for consistent crop quality.
Should I choose fixed or adjustable spectrum LED fixtures?
For most commercial greenhouse operations, fixed spectrum white LEDs are the better choice. They cost less, have fewer components to fail, and deliver a well balanced spectrum that covers the full photosynthetic range. Adjustable spectrum fixtures make sense primarily for research institutions or breeding programs where precise wavelength control is part of the experimental design.
How do I estimate fixture count before getting a formal lighting design?
Use the formula: Number of fixtures = (Required PPFD × Growing area in m²) / (PPF per fixture × Utilization factor). Utilization factors for greenhouse top lighting typically range from 0.7 to 0.9. This gives a planning estimate that a professional photometric layout will refine.
What is a typical payback period for greenhouse LED lighting?
Payback depends heavily on crop value, electricity rates, climate, and available rebates. High value crops like cannabis in areas with strong rebate programs can see payback under 2 years. Vegetable greenhouses typically fall in the 2 to 5 year range. The revenue impact of increased winter yields is usually more significant than the energy savings alone.
Starting a greenhouse lighting design project involves real money and real complexity. Getting the calculations, fixture selection, spectrum, layout, and controls right from the beginning saves far more than it costs.
Schedule a free consultation with a lighting expert to walk through your facility’s specific DLI deficit, layout options, and rebate eligibility.