Commercial Cannabis LED Grow Lights: 2026 Buyer's Guide
Discover how commercial cannabis LED grow lights boost yields, cut HVAC costs, and speed ROI. Our 2026 glossary explains PPFD, DLI, PPE and rebates.
TL;DR
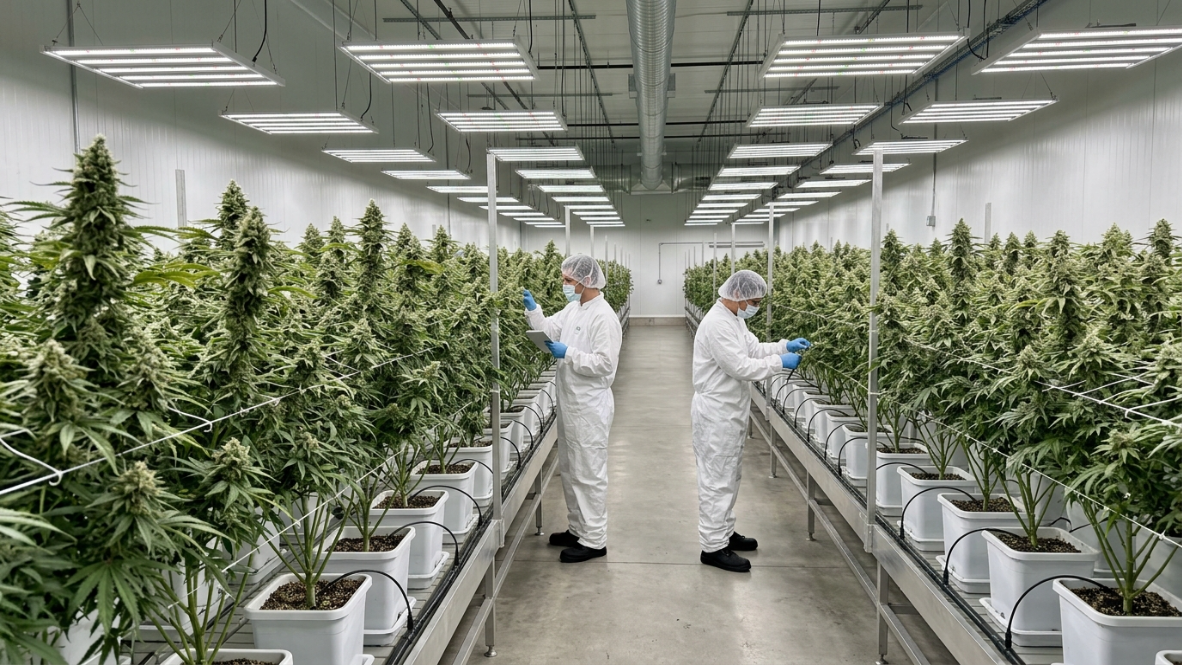
Commercial cannabis LED grow lights are evaluated using a chain of metrics: PAR defines useful light, PPF measures fixture output, PPFD measures what hits the canopy, and DLI captures total daily light delivery. Photon efficacy (PPE), measured in µmol/J, is the single most important comparison metric for commercial buyers. Modern full spectrum, multi bar LED fixtures with PPE above 2.5 µmol/J offer 30 to 50% energy savings over HPS, with typical ROI achieved in 12 to 18 months. DLC certification unlocks utility rebates that can offset 30 to 70% of fixture cost.
Commercial cannabis lighting vocabulary is dense. Misunderstand one metric and you risk specifying the wrong fixture for a 10,000 square foot flower room, overpaying on electricity, or leaving five figures in utility rebates on the table.
This glossary exists to prevent those mistakes. Every term below is defined in the context of commercial cannabis operations, not backyard grows or generic horticulture. Each entry answers two questions: what does this term mean, and why should a facility operator spending six figures on lighting actually care?
Bookmark this page. It’s the reference you’ll come back to during procurement conversations, facility design meetings, and rebate applications.
Talk to a lighting expert for guidance on your specific facility.
Commercial Cannabis LED Grow Lights at a Glance
Commercial cannabis LED grow lights use high efficiency full spectrum LEDs to maximize flower production while reducing electricity and HVAC costs compared to HPS systems.
For most commercial facilities, buyers should prioritize these specifications:
| Factor | Recommended |
|---|---|
| Photon Efficacy (PPE) | 2.5 to 2.8+ µmol/J |
| Flower PPFD | 800 to 1,500 µmol/m²/s |
| DLI | 40 to 45 mol/m²/day |
| Fixture Type | Multi bar LED |
| Protection Rating | IP65+ |
| DLC Listed | Yes |
| Warranty | 5+ years |
Facilities switching from HPS typically reduce lighting electricity by 30 to 50%, lower cooling requirements, improve canopy uniformity, and often recover the investment within 12 to 18 months before rebates.
How to Use This Glossary
Many lighting terms depend on one another. Instead of reading alphabetically, follow this progression:
- PAR
- PPF
- PPFD
- DLI
- PPE
- Spectrum
- Fixture Design
- Controls
- Rebates
- ROI
Understanding the metrics in this order makes comparing commercial cannabis LED grow lights significantly easier.
Light Science Fundamentals
These terms build on each other in a logical chain. Understanding them in sequence, rather than alphabetically, makes the whole system click.
PAR (Photosynthetically Active Radiation)
PAR refers to the spectrum of light that plants use for photosynthesis, specifically wavelengths between 400 and 700 nanometers. Think of PAR as the definition of “useful light” for plants.
Why commercial growers care: metrics like lumens and lux measure light as human eyes perceive it. They’re nearly useless for evaluating grow lights. A fixture could produce blinding output in wavelengths plants barely use. PAR is the foundation that every other meaningful metric builds on. If a manufacturer quotes lumens instead of PAR based measurements, that’s a red flag.
PPF (Photosynthetic Photon Flux)
PPF tells you how many photons of PAR light a fixture emits per second. It’s measured in µmol/s (micromoles per second). This is a fixture level output metric, representing total photon production regardless of where those photons actually land.
Why commercial growers care: PPF is how you compare the raw output of two fixtures sitting on a bench, stripped of variables like mounting height and reflector design. When evaluating commercial cannabis LED grow lights, focus on PPF and efficacy first, then worry about how the light distributes across your canopy. For a clear breakdown of when to use each metric, see this PPF vs PPFD guide.
PPFD (Photosynthetic Photon Flux Density)
PPFD measures the amount of PAR light that actually arrives at a specific point on your plant canopy. It’s measured in µmol/m²/s (micromoles per square meter per second). While PPF describes total fixture output, PPFD describes what the plant experiences at a given location.
A critical caveat for commercial buyers: lighting companies that only publish the PPFD at the center point of a coverage area grossly overestimate actual performance. Light is always brightest at center and falls off toward the edges. Demand a full PPFD map showing measurements across the entire coverage area at a specified height, not a single cherry picked number. For a deeper treatment of cannabis specific targets, see this cannabis PPFD guide.
Strict PPFD targets are best treated as guidance rather than absolutes. Published ranges (see table below) are starting points, but growers should refine them through plant observation and performance data, adjusting for genetics, environment, and growing system.
Cannabis PPFD Targets by Growth Stage:
| Growth Stage | Target PPFD (µmol/m²/s) | Notes |
|---|---|---|
| Seedlings / Clones | 100 to 300 | Gentle intensity to avoid stress and maintain photoperiod |
| Vegetative | 400 to 600 | Supports structural growth |
| Flowering | 800 to 1,500 | Cannabis is a high light demand crop in flower |
| Flowering + CO₂ | Up to 1,500+ | Photosynthesis rate keeps climbing with CO₂ supplementation |
For detailed guidance on achieving these targets in sealed indoor cannabis cultivation rooms, light planning software and professional consultation make a meaningful difference at scale. Comprehensive coverage of PPFD for cannabis flower stage is available separately.
DLI (Daily Light Integral)
DLI measures the total amount of PAR light plants receive over a full 24 hour period. Expressed in mol/m²/day (moles per square meter per day), it captures what PPFD alone cannot: cumulative light delivery accounting for both intensity and photoperiod length.
DLI is arguably the most important metric for predicting overall growth rate. Two facilities running very different PPFD levels and photoperiod lengths could deliver the same DLI and see similar results. For a complete breakdown of how to calculate and optimize DLI across growth stages, see the cannabis DLI guide.
Cannabis plants can utilize DLI values up to approximately 40 to 45 mol/m²/day, with diminishing returns beyond that point unless CO₂ supplementation is used. In greenhouse operations, supplemental lighting fills the gap between what the sun provides and the DLI target.
Photon Efficacy / PPE (µmol/J)
Photon efficacy measures how efficiently a lighting system converts electrical energy into PAR photons. The unit is µmol/J (micromoles per joule). This is the single most important number when comparing commercial cannabis LED grow lights.
Benchmarks that matter:
- Minimum acceptable for commercial indoor facilities (1,000+ sq ft of canopy): above 2.1 µmol/J
- Good commercial grade: above 2.5 µmol/J
- Top tier fixtures (2025/2026): exceeding 2.8 µmol/J
Every 0.1 µmol/J gain in efficacy cuts energy consumption by roughly 3%. Across a facility running hundreds of fixtures for 12+ hours daily, that adds up to thousands of dollars per year.
If a manufacturer doesn’t list efficacy, assume it’s poor. When verifying efficacy claims, look for third party testing or a horticulture lighting facts label rather than trusting marketing spec sheets alone.
Light Saturation Point
The light saturation point is the intensity level beyond which increasing light will no longer increase the rate of photosynthesis. The leaf simply can’t process more photons.
For cannabis without CO₂ supplementation, this typically occurs around 800 to 1,000 µmol/m²/s. The saturation point is usually set by another limiting factor, most often CO₂ concentration. This is exactly why commercial facilities pair high intensity LED lighting with CO₂ supplementation: it lifts the ceiling, letting plants productively use PPFD levels up to 1,500 µmol/m²/s.
Photobleaching Risk Management
Photobleaching occurs when light intensity exceeds the plant’s capacity to process photons, causing localized bleaching of flower tissue (white or pale tips on colas). It is not the same as nutrient burn or heat stress, though the three are often confused. A detailed comparison of cannabis light burn vs deficiency can help with diagnosis.
In commercial cannabis, photobleaching risk increases sharply when PPFD exceeds 1,200 µmol/m²/s without adequate CO₂, or when fixtures are mounted too close to the canopy top. Practitioners on Reddit report that photobleaching most commonly appears in the top 2 to 3 inches of colas directly beneath fixtures, particularly in rooms where dimming schedules weren’t adjusted after plant stretch.
Managing photobleaching requires three things working together: maintaining proper mounting height (discussed below), running dimming schedules that ramp intensity gradually during flower, and supplementing CO₂ to at least 1,200 ppm when pushing high PPFD. Plants that are photobleached lose THC and terpene content in the affected tissue, so the damage is both cosmetic and economic.
Mounting Height
Mounting height is the distance between the bottom of the fixture and the top of the plant canopy. It directly determines PPFD at the canopy surface due to the inverse square law, and it is one of the most frequently misconfigured variables in commercial grows.
Most multi bar LED fixtures designed for cannabis flower rooms are specified for 8 to 14 inches above the canopy top. Mounting too high wastes photons (intensity drops with the square of distance). Mounting too low creates hot spots, increases photobleaching risk, and compresses the light footprint so edges receive far less light than center.
For commercial facilities, ceiling height constrains mounting options. A room with 10 foot ceilings and plants that stretch to 5 feet leaves roughly 5 feet of working space, which must accommodate the fixture, hanging hardware, and the recommended gap to canopy. Facilities designing new builds should plan ceiling height around their target fixture to canopy distance plus expected plant height plus at least 12 inches for hardware and airflow.
One YouTube walkthrough from a facility manager documented a 15% uniformity improvement simply by raising fixtures 3 inches and reducing output by 5% via dimming, delivering the same average PPFD with far less edge falloff.
PPFD Map / Light Plan
A PPFD map is a grid of PPFD measurements taken across a defined growing area at a specified height. It shows how evenly (or unevenly) a fixture or array of fixtures distributes light. A light plan extends this concept to an entire room, modeling fixture placement, spacing, and mounting height to predict canopy level uniformity.
Commercial operators should demand PPFD maps before procurement. Uniformity matters enormously at scale. A room that averages 1,000 µmol/m²/s but swings from 600 in the corners to 1,400 in the center will produce inconsistent flower quality, exactly the kind of variation that hurts wholesale pricing.
Veg vs. Flower Footprint
A single fixture rarely covers the same area equally well for both vegetative and flowering stages. The reason is straightforward: veg rooms typically target 400 to 600 µmol/m²/s, while flower rooms push 800 to 1,500 µmol/m²/s. When you dim a fixture down for veg, the footprint widens because you can mount higher without exceeding intensity targets. When you run full power for flower, the footprint shrinks as you bring the fixture closer and tighter to the canopy.
Manufacturers sometimes list two coverage specs: a veg footprint (say 5’x5’) and a flower footprint (say 4’x4’). These are not interchangeable. A facility planning separate veg and flower rooms should spec fixtures for each room independently. Buying one fixture to “do both” usually means compromising PPFD uniformity in flower or overspending on intensity in veg.
For veg specific guidance, including DLI targets and PPFD for cannabis veg stage, a separate resource covers the numbers in detail.
Facilities running the same fixtures in both rooms can make it work by adjusting fixture count, mounting height, and dimming levels per room, but this requires deliberate layout planning, not assumptions based on a single rated footprint.
Coverage Planning by Canopy Area
Coverage planning determines how many fixtures a room needs, where they go, and at what output level they should run to hit PPFD and uniformity targets across every square foot of canopy.
The process starts with the room’s usable canopy area (not total floor space), your target PPFD, and the fixture’s published PPFD map at a given mounting height. From there, you calculate fixture count, spacing, and row offset to minimize edge falloff. Most commercial LED manufacturers provide light planning software or will generate a custom plan for your room dimensions.
A common mistake is planning coverage based on the fixture’s “rated footprint” without accounting for overlap zones. In practice, adjacent fixtures need 15 to 25% overlap to achieve uniform canopy level light. Skipping this step creates dead zones between fixtures that show up as thin, underdeveloped flower in exactly those spots.
For facilities running under canopy lighting alongside top lights, coverage planning should account for both layers. The top light plan determines primary PPFD distribution, while the under canopy plan fills in the lower canopy zones (covered in detail below).
Inverse Square Law
Light intensity decreases proportionally to the square of the distance from the source. Double the distance from your fixture to the canopy, and PPFD drops to one quarter. In practice, this means mounting height is a critical variable. Even a few inches of height change affects intensity significantly.
For commercial cannabis, this law has real implications for ceiling height requirements, fixture to canopy distance specifications, and the case for multi bar fixtures that spread light across a wider area rather than concentrating it from a single point.
Spectrum and Light Quality
Full Spectrum
A full spectrum LED grow light produces a continuous range of wavelengths across the PAR band, mimicking the distribution of natural sunlight. Modern commercial cannabis LED grow lights typically achieve this using white LEDs in the 3000K to 3500K color temperature range, supplemented with dedicated red diodes at 660nm. For a deeper look at how different spectra affect plant morphology, see this summary of light spectra impact.
Research suggests that fixture efficacy and the initial cost of the fixture are more important for return on investment than spectral distribution at high photon flux. Translation for commercial buyers: don’t overpay for exotic spectrum channels at the expense of raw PPFD and PPE. Full spectrum white light, combined with high efficacy, covers cannabis needs across all growth stages and provides a comfortable working environment for employees, which matters more than people realize at commercial scale.
Programmable Spectrum and Remote Control
Some commercial fixtures offer programmable spectrum, meaning operators can adjust the ratio of blue, red, far red, and white channels either manually or through software. The appeal is obvious: tune the light recipe per growth stage, per cultivar, or even per room.
In practice, programmable spectrum fixtures carry trade offs that commercial buyers should evaluate carefully. The additional diode channels and driver circuitry add cost and create more potential failure points. Efficacy per channel is not uniform; blue and far red channels typically convert watts to photons less efficiently than the broad spectrum white and red channels that do the heavy lifting. Practitioners on cannabis growing forums note that most facilities with tunable fixtures end up running a single recipe 90% of the time because the marginal gains from spectral tuning rarely justify the complexity.
Where programmable spectrum adds genuine value is in research operations and facilities running many genetically distinct cultivars with known spectral preferences. For the majority of single cultivar or limited rotation commercial grows, a high efficacy full spectrum white fixture outperforms a tunable fixture that sacrifices PPE for flexibility.
Remote control, by contrast, is almost universally valuable at commercial scale. The ability to adjust dimming, scheduling, and on/off status from a central interface (whether that’s a dedicated controller, a building management system, or a cloud dashboard) eliminates the labor of manually adjusting fixtures across dozens of rooms. Remote control via 0 to 10V, MODBUS, or proprietary protocols also enables data logging, alerting on fixture faults, and integration with environmental controls. When evaluating fixtures, prioritize remote dimming and scheduling capability over spectral tunability unless the operation genuinely needs per channel control.
Blurple / Narrowband Spectrum
“Blurple” describes the purple pink hue produced by LED fixtures limited to narrow red and blue wavelength bands. These were common in early generation LED grow lights based on the logic that plants primarily absorb red and blue light.
Two problems killed blurple for commercial use. First, the harsh pink light makes it nearly impossible to visually inspect plants for pests, deficiency, or disease, a genuine safety and quality control issue when managing tens of thousands of plants. Second, controlled environment horticulture research and commercial trials generally support broad spectrum (white) LED fixtures as the practical standard because they deliver high photon efficacy and better overall crop performance.
Color Temperature (Kelvin)
Kelvin (K) describes the color appearance of white light. Lower values (2700K to 3000K) skew warm and red heavy. Higher values (5000K to 6500K) skew cool and blue heavy. In cannabis LED lighting, fixtures around 3000K to 3500K provide a broad spectrum balanced toward the red wavelengths that drive flowering, while still including enough blue for healthy vegetative structure.
Blue Light (400 to 500nm)
Blue wavelengths promote compact, stocky vegetative growth and influence stomatal opening. In commercial cannabis, adequate blue light during veg helps produce the strong branching structure that supports heavy flower sets later.
Red Light (600 to 700nm)
Red wavelengths are the primary drivers of photosynthesis and flowering response in cannabis. The 660nm peak is particularly important for flower initiation and development. Most commercial cannabis LED grow lights concentrate a significant portion of their output in this band.
Far Red (730nm)
Far red light falls just outside the traditional PAR band but plays a role in triggering specific plant responses, including the Emerson enhancement effect (which can boost photosynthetic efficiency) and phytochrome mediated shade avoidance responses. Some high end commercial fixtures include far red channels for photoperiod manipulation or end of day treatments.
UV A / UV B
Ultraviolet light (specifically UV A in the 360 to 400nm range and UV B around 280 to 315nm) can trigger stress responses in cannabis that increase the production of trichomes, terpenes, and secondary metabolites. The key word is “controlled.” Too much UV damages tissue.
Commercial applications typically involve supplemental UV fixtures run for limited periods during late flower, not as a primary light source. According to research published by Utah State University’s CGEC, UV B exposure at controlled doses increased cannabinoid concentrations in certain cultivars, though the response varies significantly by genetics.
UV and IR (infrared) channels are increasingly available as add on modules rather than integrated into the primary fixture. This modular approach makes sense. UV diodes degrade faster than white or red LEDs, so building them into your $1,000+ top light shortens that fixture’s effective lifespan. Separate UV bars can be replaced independently and scheduled to run only during the specific late flower windows where they provide benefit, typically the final 2 to 4 weeks. IR (near infrared, around 730nm) overlaps with far red functionality and is used primarily for end of day signaling to speed dark period initiation.
Subcanopy Light Spectrum Selection
Spectrum choice for under canopy fixtures deserves separate consideration from top lights. The primary goal below the canopy is driving photosynthesis in shaded tissue, not regulating morphology. Because lower canopy flower sites receive heavily filtered light (the upper canopy absorbs most blue and red wavelengths, transmitting proportionally more green and far red), supplemental bars placed below the canopy are most effective when they deliver a full spectrum white output similar to the top lights.
Some growers experiment with red heavy under canopy bars to maximize photosynthetic efficiency per watt. Practitioners on cannabis growing forums report mixed results with this approach: while pure red can drive photosynthesis efficiently, it makes visual inspection of lower canopy health nearly impossible, the same problem that killed blurple fixtures for top lighting. Full spectrum white under canopy bars (3000K to 3500K) provide a practical balance of photosynthetic output and workability.
The Boost XE under canopy LED bar uses full spectrum white light with the same phosphor technology as Thrive’s top light fixtures, maintaining visual consistency throughout the canopy while delivering 120W of targeted output per bar.
Fixture Types and Form Factors
Fixture form factor is not just an aesthetic choice. It determines light distribution, heat management, mounting flexibility, and ultimately how well a fixture performs across a commercial canopy. The four main categories in commercial cannabis are multi bar, panel, COB, and supplemental bar.
Multi Bar LED Fixtures
Multi bar fixtures spread LED diodes across several parallel bars (typically 4 to 8 bars per fixture) connected by a central driver housing or frame. This is the dominant form factor in commercial cannabis for good reason.
By distributing the light source across a wide area rather than concentrating it at a single point, multi bar fixtures produce dramatically better uniformity across the canopy. The wider source geometry reduces hot spots, lowers the required mounting height, and creates a more even PPFD profile from center to edge. This matters at scale because uniform light means uniform flower quality, which means consistent wholesale pricing.
Multi bar fixtures also run cooler per unit area than concentrated designs because heat is spread across a larger surface. Passive cooling (no fans) is standard on commercial multi bar LEDs, which eliminates fan noise, fan dust accumulation, and fan failure as maintenance concerns.
The Pinnacle series is a representative example: available in 300W, 600W, and 840W configurations, the multi bar design delivers the uniformity and efficacy that large flower rooms require.
Panel Style LED Fixtures
Panel fixtures (sometimes called quantum boards) mount all their LEDs on a single flat board, typically square or rectangular. The diodes sit close together on one plane.
Panels work well for small grows, home setups, and compact spaces where a single fixture covers one or two plants. The form factor is simple, relatively inexpensive to manufacture, and easy to hang. For those reasons, panels dominate the consumer and small commercial market.
The limitation shows up at commercial scale. Because all the light originates from a concentrated flat surface, panels behave more like a point source than a distributed one. The center directly below the panel gets significantly more light than the edges, creating a pronounced hot spot pattern. Achieving uniform PPFD across a 4’x8’ or larger canopy with panels requires either mounting them very high (which wastes intensity per the inverse square law) or packing panels tightly together with extensive overlap, which negates their cost advantage.
For facilities over 1,000 square feet of canopy, multi bar fixtures are the standard. Panels remain a viable option for small veg rooms, mother plant areas, or budget constrained startups that plan to upgrade later.
COB (Chip on Board) Style LED Fixtures
COB fixtures use a single, high powered LED chip (or a small cluster of chips) mounted directly onto a substrate, producing intense light from a very small area. COBs were considered cutting edge around 2016 to 2018 and offered significant efficacy improvements over the blurple panels of that era.
The problem is concentration. A COB fixture is essentially a point source. It creates the most extreme version of the center hot spot problem, requiring significant mounting height to spread light across a reasonable area. At the mounting distances needed for acceptable uniformity (often 24+ inches), a substantial portion of photons miss the canopy entirely or hit walls. This makes COB fixtures inherently less efficient at delivering light to plants compared to multi bar designs, even when the diode level efficacy is competitive.
COBs also generate considerable heat from a small surface area, typically requiring active cooling (fans or heat sinks with significant mass). The thermal density accelerates LED degradation over time, shortening effective fixture life compared to passively cooled multi bar designs where heat is distributed.
COB fixtures still have niche applications in very small commercial spaces, supplemental spot lighting, or research chambers where a concentrated beam is actually desirable. For commercial cannabis flower rooms, the industry has moved past COBs for the same reasons it moved past blurple: better form factors now exist that deliver more usable light per watt to the actual canopy.
Build Quality and Material
Build quality sounds like a vague differentiator until you’re managing 200+ fixtures in a hot, humid grow environment. Then it becomes one of the most practical considerations in the procurement decision.
Housing material. Commercial fixtures use either extruded aluminum, die cast aluminum, or (in budget products) sheet steel. Aluminum is the clear winner for cannabis applications: it’s lightweight, corrosion resistant, and acts as a passive heat sink. Die cast aluminum housings offer the best thermal performance because the casting process creates thicker, more thermally conductive structures than extrusion. Sheet steel fixtures are cheaper but heavier, rust prone in humid environments, and provide poor thermal management.
LED board construction. The substrate that LEDs are mounted on affects both thermal transfer and long term reliability. Metal core printed circuit boards (MCPCBs) are the commercial standard because they transfer heat away from the LED junction far more effectively than standard FR4 fiberglass boards. Budget fixtures sometimes use FR4 to cut costs, and the result is faster lumen depreciation and shorter fixture life.
Connector and seal quality. IP65 rated fixtures should have properly gasketed enclosures and waterproof connectors. Practitioners on Reddit report that cheaper IP65 “rated” fixtures often fail at the connector points, where silicone seals degrade within 12 to 18 months of exposure to sulfur based foliar sprays. Look for fixtures with industrial grade IP rated connectors (like Amphenol or equivalent), not consumer grade barrel jacks with aftermarket waterproofing.
Lens or optics. Some multi bar fixtures use secondary optics (lenses or reflectors) over individual LEDs to shape the beam angle. While these can improve uniformity at certain mounting heights, they also reduce total light output by 5 to 10% due to optical losses. Most high end commercial cannabis fixtures skip secondary optics in favor of bare diode arrays mounted across enough bars to achieve uniformity through geometry alone.
A good proxy for build quality: the fixture’s L90 rating, which measures how many hours the fixture operates before output degrades to 90% of initial. Commercial grade fixtures should specify L90 at 36,000 hours or higher. If a manufacturer won’t publish their L90, that tells you something.
Top Light / Supplemental Light
Top light refers to the primary overhead fixtures designed to deliver most canopy level PPFD across the target footprint (as defined by a light plan and verified with a PPFD map). In commercial rooms, top lighting is specified to meet both an average intensity target and a uniformity target, because PPFD variability across the canopy translates directly into uneven growth, inconsistent ripening, and non uniform finished flower.
Supplemental light is any additional lighting used to close a specific performance gap that top light alone cannot address efficiently. Common categories include:
- Under canopy (subcanopy) lighting: raises photon delivery to lower flower sites that are otherwise light limited due to self shading and canopy architecture, improving lower canopy development and reducing low value “popcorn” formation.
- Inter lighting: fixtures placed within the canopy (more common in greenhouse rows and high density systems) to improve distribution to mid canopy tissue when top down penetration is the limiting factor.
- Photoperiod extension / low intensity supplemental lighting: lighting run at relatively modest PPFD for longer hours to increase total daily light (DLI) when adding more instantaneous intensity would be constrained by heat load, CO₂ availability, or diminishing photosynthetic return. More detail on cannabis light schedules covers this approach.
Why commercial growers care: the objective is not simply “more light,” but placing photons where they produce incremental yield and quality while respecting constraints like HVAC capacity, canopy temperature, and CO₂ concentration.
Intercanopy vs. Subcanopy Lighting
These two terms are often used interchangeably, but they describe different fixture placements with different goals.
Intercanopy lighting (also called interlighting) positions fixtures vertically within the canopy layer itself, typically between plant rows or between trellis layers. The fixtures sit at roughly the same height as mid canopy foliage. This approach is more common in greenhouse tomato and cucumber production, where tall, trellised plants create deep canopy profiles. In cannabis, intercanopy lighting is occasionally used in vertical rack systems or SOG (sea of green) configurations where plant spacing allows fixtures to sit between rows.
Subcanopy lighting places fixtures below the plant canopy, aimed upward at the undersides of lower branches and flower sites. This is the dominant supplemental approach in commercial cannabis because most indoor flower rooms use a flat canopy architecture (SCROG or trellis net) that creates a dense upper layer blocking light to everything beneath it.
The practical difference matters for design. Intercanopy fixtures need to be slim enough to fit between plants without obstructing airflow or creating physical interference during maintenance. Subcanopy fixtures need to be positioned below the lowest productive branches, typically 6 to 18 inches above the pot or growing medium.
For most commercial cannabis flower rooms with a horizontal trellis architecture, subcanopy lighting delivers better ROI because the light deficit below the canopy is more severe and more uniform than the deficit within the mid canopy zone.
Canopy Structure Assessment
Before specifying any under canopy lighting, a canopy structure assessment determines where light is actually needed. Not every facility benefits equally. The assessment evaluates three things:
Canopy density. Dense, heavily trellised canopies with thick upper foliage block more light to lower sites. These setups benefit most from subcanopy supplementation. Open, lightly trained canopies with good natural light penetration may not need it.
Canopy depth. The vertical distance between the trellis net (or top of canopy) and the lowest productive flower sites. Cannabis canopies with 18+ inches of productive depth below the net are strong candidates. Shallow canopies under 12 inches see less benefit.
Strain variability. Some genetics produce naturally open architectures with good light penetration. Others produce dense, bushy structures that self shade aggressively. A facility running multiple cultivars may need under canopy lighting in some rooms but not others.
The assessment should include PAR measurements at multiple vertical positions within the canopy using a quantum sensor. A common finding: PPFD at 12 inches below a dense cannabis canopy drops to 10 to 20% of the top canopy value. That gap represents the yield being left on the table. For a detailed breakdown of common setup errors, see under canopy lighting mistakes.
Under Canopy Lighting
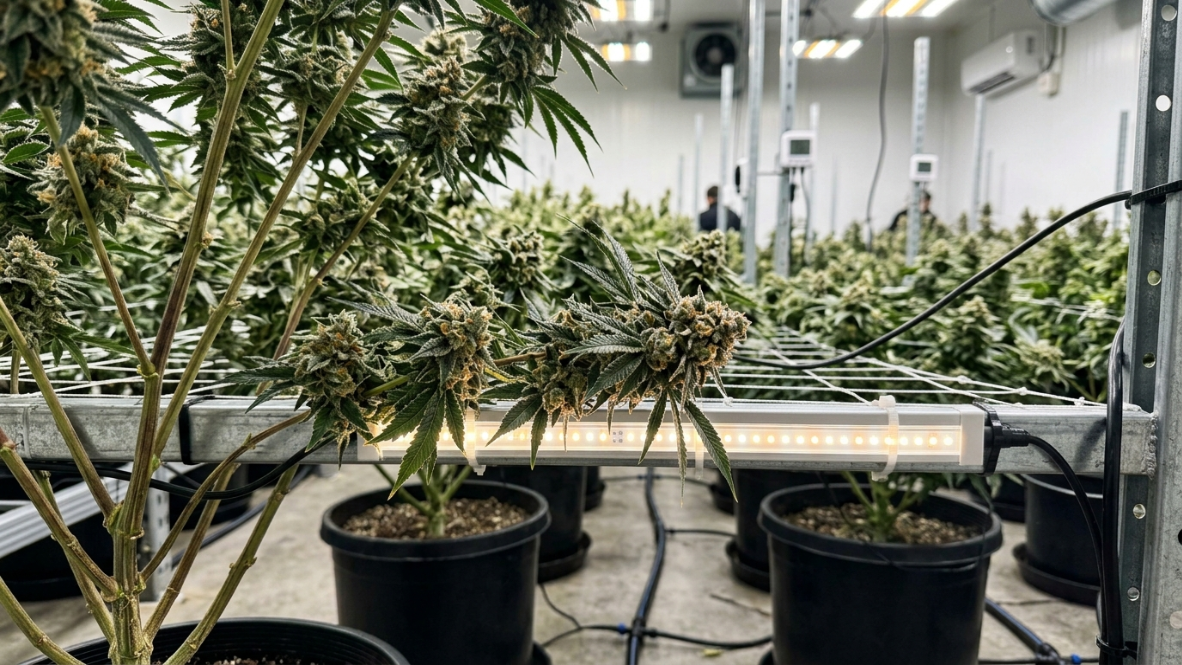
Under canopy lighting places supplemental LED bars below or within the plant canopy to illuminate lower branches and flower sites that overhead fixtures can’t reach. Without it, these lower zones receive a fraction of the light available at the canopy top, producing what growers call “popcorn buds,” small, underdeveloped flowers with minimal market value.
The data supporting under canopy lighting is strong. Studies consistently show yield increases of 20 to 30% compared to overhead only configurations, with some commercial growers reporting gains up to 60% in dense, multi layer setups under optimized conditions (adequate CO₂, proper VPD, calibrated nutrients).
This is an emerging category with real commercial impact. Rather than increasing total system wattage by running overhead lights harder, under canopy bars add light exactly where it’s most needed.
Under Canopy PPF Targets
Specifying under canopy lighting isn’t about blasting the lower canopy with maximum intensity. There’s a sweet spot.
The goal is to raise lower canopy PPFD from its typical 50 to 150 µmol/m²/s (self shaded baseline) into the 150 to 400 µmol/m²/s range at the lower flower sites. This brings lower buds above the minimum threshold for productive photosynthesis without overdriving the tissue, which is adapted to low light conditions and can photobleach or stress at intensities the upper canopy handles easily.
A useful rule of thumb from commercial growers: target roughly 200 to 300 µmol/m²/s measured at the surface of lower flower sites, with bars positioned 6 to 12 inches from the nearest flower tissue. This translates to under canopy fixtures running at approximately 80 to 120 watts per 4 foot bar, depending on bar count per canopy area and room geometry.
One project manager shared in a YouTube walkthrough that their facility achieved the best lower bud development at 250 µmol/m²/s measured at the lower cola surface, running 120W bars at 8 inch distance. Going higher than 350 µmol/m²/s at the lower flowers didn’t improve yield further and created heat pockets that required additional airflow.
For a complete financial analysis of under canopy investment, see this under canopy lighting ROI guide.
Product Comparison for Under Canopy LEDs
Under canopy lighting is a growing product category, and not all fixtures are designed for the application. When evaluating under canopy LED bars for commercial cannabis, compare on these criteria:
| Feature | What to Look For |
|---|---|
| Wattage | 60 to 120W per bar is typical for cannabis |
| Form Factor | Slim, low profile bars that fit below trellis without blocking airflow |
| Spectrum | Full spectrum white (3000K to 3500K) preferred for visual inspection |
| IP Rating | IP65+ (subcanopy environment is humid and exposed to irrigation) |
| Mounting | Adjustable height brackets or trellis clips for repositioning during flower |
| Daisy Chain | Multiple bars per control signal reduces wiring complexity |
| DLC Listed | Required for rebate eligibility |
| Dimming | 0 to 10V minimum for gradual ramp during flower stages |
The Boost XE is a 120W bar designed specifically for under canopy cannabis applications, with full spectrum white output, IP65 rating, daisy chain capability, and OptiDrive compatibility. It uses the same patented phosphor chemistry as Thrive’s top light fixtures.
Power, Controls, and Infrastructure
LED Driver
The LED driver is the power supply that converts AC mains electricity into the regulated DC current that LED chips require. In conventional fixture designs, the driver is built into the fixture housing. This is fine for a few lights, but in commercial facilities running hundreds of fixtures, those built in drivers collectively add significant weight, heat, and failure points directly in the grow environment.
Remote / Centralized Power Architecture
A remote or centralized power architecture moves the LED drivers out of the grow room entirely, housing them in a separate electrical room or rack. The fixtures become lighter, simpler, and produce less heat at the canopy. For a complete treatment of how this approach changes installation economics and HVAC sizing, see remote driver LED grow lights.
This concept is gaining traction because even though LEDs produce less heat than HPS, hundreds of individual in fixture drivers in a commercial grow room still generate substantial thermal load.
Centralized power architecture can reduce in room heat sources by relocating drivers out of the grow space, which may lower HVAC sizing requirements and simplify maintenance in some facility designs. The magnitude of HVAC and installation savings is highly site specific (room volume, setpoints, dehumidification strategy, driver efficiency, distribution losses, and electrical layout), so these impacts should be validated with an engineered load calculation and an installation labor estimate during design. The OptiDrive centralized power platform is designed for this approach, available in both high voltage DC and low voltage distribution configurations to suit new builds and retrofits.
Input Voltage: 100 to 277V and Beyond
Commercial LED grow lights are designed to operate across a range of input voltages, and understanding your facility’s electrical infrastructure before ordering fixtures prevents costly surprises.
Most commercial fixtures accept a universal input range of 100 to 277V AC, which covers the standard voltages found in North American commercial buildings: 120V single phase, 208V three phase, 240V split phase, and 277V (the line to neutral voltage of a 480V three phase system common in large commercial and industrial facilities).
Why this matters for commercial cannabis: many purpose built grow facilities run 277V circuits to their lighting panels because higher voltage means lower amperage for the same wattage, which allows smaller wire gauges, fewer circuits, and lower electrical installation costs. According to NEC guidelines published by NFPA, commercial lighting circuits at 277V can serve more fixtures per breaker than 120V circuits, reducing panel count and conduit runs.
A facility running 200 fixtures at 600W each on 120V circuits would need substantially more breakers, larger wire, and more panel space than the same deployment at 277V. The electrical infrastructure savings can reach tens of thousands of dollars on a large build.
Some centralized power systems, like OptiDrive DC, accept input voltages up to 600V AC and distribute high voltage DC to the fixtures, further simplifying the electrical architecture for large scale deployments. When evaluating fixtures, confirm the input voltage range matches your panel voltage, and if you’re designing a new build, consult with your electrical engineer about running 277V or higher to the lighting distribution panels.
One common mistake: buying fixtures rated for 100 to 277V and wiring them at 120V because “it’s simpler.” This works electrically but doubles the amperage per fixture, which means twice the wire gauge, twice the circuit count, and a significantly more expensive electrical build.
0 to 10V Dimming
The most common analog control protocol for commercial LED grow lights. A 0 to 10V signal from a climate controller or timer adjusts fixture output from off (0V) to full power (10V). It’s simple, reliable, and widely supported across fixtures and building management systems.
When specifying fixtures, make sure drivers accept the control protocol your climate computer outputs, whether that’s 0 to 10V, RS 485, DALI, or another standard. Mismatches create expensive wiring headaches during installation.
Dimming Schedule
A dimming schedule is the programmed intensity curve that controls how fixture output changes throughout the day and across growth stages. In commercial cannabis, dimming is not just about turning lights down; it’s a precision tool for managing plant stress, energy consumption, and canopy temperature.
A typical flower room dimming schedule might look like this:
- Week 1 of flower (transition): 60 to 70% output, allowing plants to acclimate to the 12/12 photoperiod change
- Weeks 2 to 4: ramp to 85 to 95% as flower sites develop and CO₂ is increased
- Weeks 5 to 8: full output (100%), assuming CO₂ is maintained at 1,200 to 1,500 ppm and VPD is dialed in
- Final 1 to 2 weeks: some growers reduce to 80 to 90% as a late flower stress reduction strategy, though this is debated
Within each day, a sunrise/sunset ramp (gradually increasing intensity over 15 to 30 minutes at lights on, reversing at lights off) reduces thermal shock and mimics natural conditions. Practitioners on Reddit note that abrupt on/off switching can cause temporary stomatal closure, reducing transpiration efficiency for the first 30 to 60 minutes of the photoperiod.
For under canopy bars, dimming schedules typically run at lower baseline output (50 to 80%) during early flower and ramp to full during peak flowering, matching the development timeline of lower bud sites. The key is keeping lower canopy PPFD in the productive range without exceeding the tissue’s capacity, which is lower than upper canopy tolerance.
MODBUS / RS 485
Digital communication protocols that allow centralized, software driven control of lighting systems. Unlike analog 0 to 10V, digital protocols enable two way communication: the controller sends commands and the fixture can report back its status, wattage, temperature, and operational hours.
For large commercial cannabis facilities, digital control becomes increasingly valuable as room count grows. It enables zone by zone dimming schedules, automated sunrise/sunset ramps, and integration with environmental control systems.
Daisy Chain
Daisy chaining connects multiple fixtures in series, allowing a single control signal or power feed to pass from one fixture to the next. This simplifies wiring significantly in commercial installations. Instead of running individual control wires to every fixture, a single chain can manage an entire row.
Daisy Chain Power Planning
While daisy chaining simplifies installation, it introduces electrical planning constraints that are easy to overlook during design.
Every daisy chain has a maximum fixture count determined by the total wattage the chain can carry and the current capacity of the connectors and wiring. Exceeding this limit causes voltage drop across the chain, which means fixtures at the end of the run receive less power and produce less light than fixtures at the beginning. In a flower room running 20+ bars per row, this creates a measurable PPFD gradient from one end of the room to the other.
Best practices for daisy chain power planning:
- Calculate total chain wattage and compare against the connector/cable rating. Most commercial fixtures specify a maximum number of fixtures per chain (commonly 8 to 16 depending on wattage).
- Measure voltage at the last fixture in each chain during commissioning. A drop exceeding 3 to 5% warrants splitting the chain or running a thicker gauge home run.
- Plan junction box locations so that chains originate from distributed power points rather than a single corner of the room.
- For under canopy bars, daisy chain limits are particularly important because bars are often deployed in higher counts per row than top lights. A row of 10 to 12 Boost XE bars (120W each) totals 1,200 to 1,440W per chain, which may require splitting across two circuits depending on wire gauge and run length.
Wattage (Actual Draw vs. Marketing Watts)
Many manufacturers describe fixture performance using total electrical watts or watts per square foot. This is misleading. Watts measure electrical input, not light output. A 600W fixture with poor efficacy produces far less useful light than a 600W fixture with high efficacy.
Always ask for actual wall draw (measured at the outlet) and then evaluate that draw against PPF output to determine efficacy. The marketing wattage often printed in product names (like “1000W equivalent”) refers to the HPS fixture the LED is designed to replace, not the LED’s actual power consumption. For more on this distinction, see avoid this common mistake when comparing LEDs to HPS.
A common rule of thumb for LED grow lights: plan for 30 to 40 watts of actual draw per square foot of canopy for flowering cannabis. This is a planning guideline, not a substitute for proper PPFD based light modeling.
IP Rating
IP (Ingress Protection) rating indicates a fixture’s resistance to dust and moisture. The rating consists of two digits: the first for solid particle protection (0 to 6), the second for liquid protection (0 to 9). A fixture rated IP65, for example, is dust tight and protected against water jets.
In commercial cannabis, the grow environment is humid, and foliar spraying is common. Fixtures rated IP65 or higher are strongly recommended. Anything below IP54 is a maintenance and safety risk in a commercial grow room.
Before Requesting a Lighting Quote, Verify:
- Fixture efficacy exceeds 2.5 µmol/J
- Full PPFD maps are available
- Uniformity has been modeled
- Fixture is DLC listed
- UL/ETL safety certification
- IP65 or higher
- Five year warranty minimum
- Driver architecture explained
- Dimming compatibility confirmed
- Utility rebate eligibility verified
- HVAC impact calculated
- ROI analysis completed
- Installation layout included
Ready to get started? Schedule a free consultation to get facility specific guidance.
Certifications, Rebates, and ROI
DLC (DesignLights Consortium) Certification
DLC certification is the qualifying standard that most utility providers use to approve LED grow light rebates. As of April 2025, DLC’s Version 4.0 technical requirements for horticultural lighting are in effect. Fixtures must meet minimum thresholds for photon efficacy (typically 2.3 to 2.7 µmol/J depending on fixture type), spectral distribution within PAR and PBAR ranges, and thermal management with proven lifetime metrics like L90 or L80.
For commercial cannabis operators, DLC certification is not optional. It’s the gateway to utility rebates that can offset 30 to 70% of total fixture cost. For a deeper explanation, read this guide on DLC listed LED grow lights.
DLC QPL (Qualified Products List)
The DLC Qualified Products List is the searchable database of all fixtures that have passed DLC testing and certification. Before committing to any fixture purchase, verify it appears on the QPL. Utility rebate programs will check, and if your fixture isn’t listed, your rebate application will be denied regardless of how good the light performs in practice.
UL / ETL / CSA Safety Certifications
These are safety certifications issued by nationally recognized testing laboratories. UL (Underwriters Laboratories), ETL (Intertek), and CSA (Canadian Standards Association) all verify that a fixture meets electrical safety standards for its intended use.
In commercial cannabis, these listings are non negotiable. Building inspectors and fire marshals require them. Insurance policies may be voided without them. Any fixture installed in a licensed commercial facility needs at minimum one of these certifications.
Utility Rebates for Cannabis LED Lighting
Utility companies offer financial incentives for energy efficient lighting upgrades. For facilities running 12 to 18 hours of daily photoperiods, transitioning from HPS to LED with qualifying rebates can offset 30 to 70% of total fixture cost. In some programs, incentives cover up to 100% of the lighting investment, but only if the fixtures are DLC listed. For guidance on navigating the rebate process, check available rebate programs.
Specific examples illustrate the range. PG&E’s Agriculture Energy Savings Action Plan offers rebates of $79 per fixture for LED grow lights with PPE of 2.86 or higher. Xcel Energy’s One Stop Efficiency Program offers $0.80 to $1.00 per watt installed for qualifying LEDs. Thrive Agritech was recognized as an Xcel Energy efficiency partner for helping growers capture these incentives.
One operational note that cannot be overstated: always get your pre approval letter in writing before signing a purchase order. Rebate programs change, budgets run out, and verbal assurances from utility reps don’t survive procurement disputes.
Prescriptive vs. Custom Rebates
Prescriptive rebates offer a fixed dollar amount per fixture or per watt based on simple qualification criteria (typically DLC listing and minimum efficacy). Custom rebates (sometimes called “calculated” or “performance based”) require a more detailed application showing projected energy savings specific to your facility, often with pre and post installation metering. Custom rebates tend to be larger but involve more paperwork and longer approval timelines.
ROI / Payback Period
Return on investment and payback period measure how quickly a lighting upgrade pays for itself through energy savings, yield increases, and reduced maintenance costs.
The ROI for replacing 1000W HPS fixtures with high efficacy commercial cannabis LED grow lights is typically achieved within 12 to 18 months. This is driven by a roughly 40% reduction in lighting electricity, significant HVAC cooling savings, and higher gram per watt yields. When utility rebates are factored in, payback can compress to under a year.
ROI and Bud Uniformity
Standard ROI calculations for LED upgrades account for energy savings, HVAC reduction, and maintenance elimination. But one of the largest financial impacts is rarely quantified in spec sheets: bud uniformity.
Wholesale cannabis pricing punishes inconsistency. A harvest that produces 60% premium flower, 25% mid grade, and 15% trim/popcorn generates significantly less revenue per pound than one that produces 80% premium and 10% mid grade. The difference between those two scenarios often traces directly to light distribution.
Facilities running properly designed LED layouts (top light uniformity within ±10% plus under canopy supplementation) consistently report a shift in their grade distribution toward higher value tiers. One commercial grower in Colorado documented a $12 per pound average price increase across their harvest after adding under canopy bars, not because the top colas improved, but because the bottom third of the plant produced sellable flower instead of trim.
When building ROI projections for a lighting upgrade, factor in this grade shift. Even a modest 5 to 10% improvement in the ratio of premium to popcorn flower compounds across multiple harvest cycles per year and can exceed the direct energy savings in total financial impact.
Total Cost of Ownership (TCO)
TCO captures every cost associated with a lighting system over its operational lifetime: purchase price, installation labor, electrical infrastructure, energy consumption, HVAC impact, maintenance, lamp replacement (for HPS), and eventual decommissioning.
Commercial cannabis LED grow lights have higher upfront costs than HPS but dramatically lower TCO. HPS bulbs degrade quickly and most commercial growers replace 1,000W DE HPS bulbs at least once per year. LEDs maintain output for 40,000+ hours without lamp replacement. LED fixtures also produce convective heat that rises away from plants, allowing cultivators to save roughly $0.40 to $0.60 on cooling for every dollar saved on lighting energy.
LED vs. HPS and MH: The Complete Comparison
The HPS to LED transition is effectively settled in new commercial builds, but many existing facilities still run legacy HPS or metal halide (MH). Here’s why the switch pencils out, and where nuance still exists.
Energy and Efficacy
Modern commercial LEDs achieve 2.5 to 2.8+ µmol/J. The best double ended HPS fixtures top out around 1.7 µmol/J, and single ended HPS sits closer to 1.0 to 1.3 µmol/J. Metal halide fixtures used for vegetative growth are even less efficient, typically 0.8 to 1.2 µmol/J. The efficacy gap translates directly to 30 to 50% lower electricity consumption for the same PPFD at the canopy.
Heat and HVAC
A 1,000W DE HPS fixture converts roughly 60 to 65% of its input power to radiant and convective heat directed at the canopy. A 600W LED delivering equivalent PPFD produces substantially less total heat, and the heat it does produce is primarily convective (rising away from the canopy rather than radiating downward). This difference reduces both cooling tonnage and leaf surface temperature stress.
However, the shift from HPS to LED changes the nature of the HVAC challenge. HPS generates so much sensible heat that it drives strong air circulation and keeps humidity in check through temperature differential alone. LED rooms run cooler, which means lower transpiration rates but higher relative humidity at equivalent absolute moisture levels. Many converted facilities discover they need to reconfigure dehumidification even as they downsize cooling.
Spectrum
HPS produces a narrow spectrum heavily weighted toward yellow and orange wavelengths (around 570 to 620nm), with minimal blue or red output. MH fixtures produce a broader, cooler spectrum with more blue content, which is why they were traditionally used for veg while HPS was used for flower. Modern full spectrum LEDs eliminate the need for separate veg and flower fixtures entirely. A single LED platform at 3000K to 3500K with supplemental 660nm red covers both stages effectively.
Maintenance and Reliability
HPS bulbs lose approximately 10 to 15% of their output within the first 5,000 hours of operation, which is why commercial growers replace bulbs at least annually. Ballasts fail, reflectors degrade and need cleaning, and the entire lamp/ballast/reflector assembly creates maintenance cycles that LED eliminates entirely. Quality LED fixtures maintain output for 40,000+ hours with less than 10% depreciation.
Where HPS Still Shows Up
Some greenhouse supplemental lighting installations continue to use HPS because the radiant heat from HPS fixtures contributes to maintaining target leaf temperatures during cold months, effectively serving double duty as both light source and heating element. In climates with very cold winters and high heating costs, this dual function can partially offset the efficacy disadvantage. The calculus changes as natural gas prices rise relative to electricity, but for some northern greenhouses, the heat contribution of HPS remains a legitimate factor in the total economic analysis.
Summary Table: LED vs. HPS vs. MH
| Factor | LED | Double Ended HPS | Metal Halide |
|---|---|---|---|
| Efficacy (µmol/J) | 2.5 to 2.8+ | 1.5 to 1.7 | 0.8 to 1.2 |
| Spectrum | Full spectrum, tunable | Narrow (yellow/orange) | Broad but blue heavy |
| Bulb Replacement | None (40,000+ hours) | Annual | Annual |
| Heat at Canopy | Low (convective, rises) | High (radiant + convective) | High (radiant + convective) |
| Dimming | Precise (0 to 100%) | Limited or none | None |
| Typical Payback vs. HPS | N/A | 12 to 18 months | 10 to 14 months |
A real world case study puts numbers to these claims. A 20,000 square foot indoor cannabis facility near Denver replaced 240 HPS fixtures with 192 LED bars. PPFD at canopy top went from 950 to 1,050 µmol/m²/s while AC load dropped from 180 tons to 110 tons. The result: 32% more dry flower weight per harvest cycle and a 31% cut in total facility energy use. For facilities considering the transition, this guide to transitioning to LED covers the operational details.
Environmental Integration Terms
Lighting doesn’t operate in a vacuum. These terms connect your lighting decisions to the broader grow environment.
VPD (Vapor Pressure Deficit)
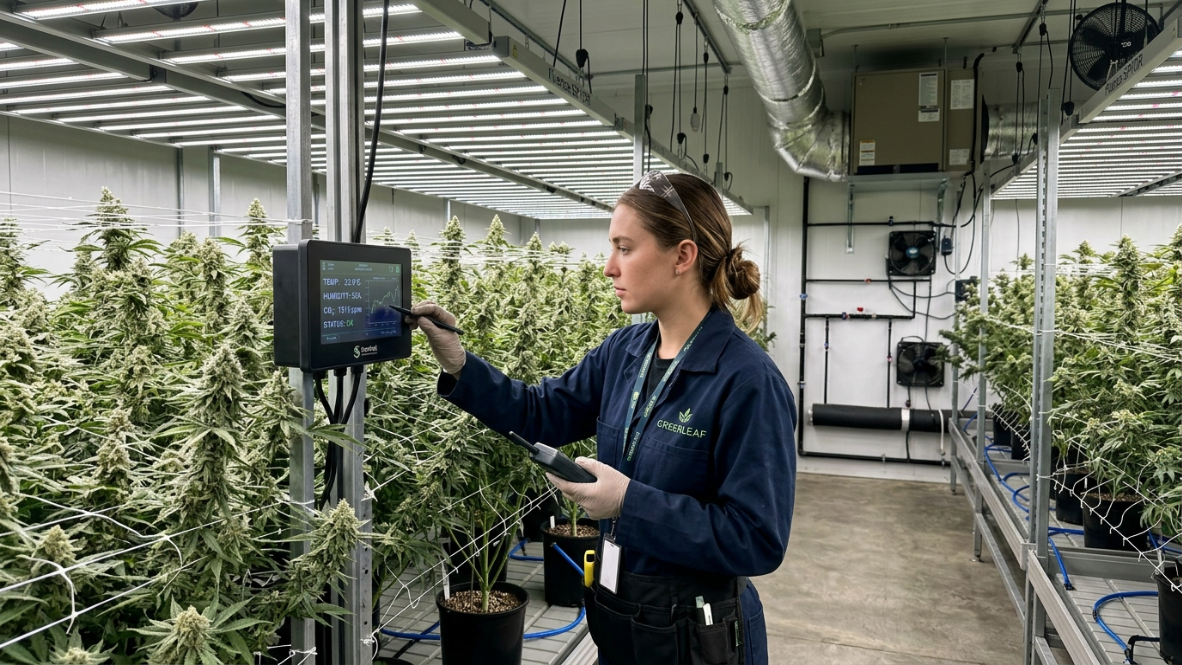
VPD measures the difference between the amount of moisture in the air and the amount the air can hold when saturated. It directly affects transpiration rate, nutrient uptake, and stomatal function.
VPD matters for lighting because higher PPFD drives faster photosynthesis, which increases transpiration. Push PPFD without adjusting VPD and you’ll stress plants rather than grow them. Commercial facilities running high intensity LED programs need to monitor and adjust VPD targets by growth stage: 0.8 to 1.2 kPa in early flower, 1.2 to 1.6 kPa in mid to late flower. For a full treatment, see this guide on VPD in cannabis cultivation.
CO₂ Supplementation
Carbon dioxide is the raw material of photosynthesis. At ambient levels (~420 ppm), cannabis reaches its light saturation point around 800 to 1,000 µmol/m²/s. Supplementing CO₂ to 1,200 to 1,500 ppm lifts that ceiling, allowing plants to productively use PPFD levels up to 1,500 µmol/m²/s. Without CO₂ supplementation, buying fixtures capable of delivering 1,500 µmol/m²/s is largely a waste of money and electricity.
HVAC and Dehumidification Impact
Every watt of electricity consumed by a grow light eventually becomes heat. In commercial cannabis facilities, lighting is the single largest contributor to cooling load. The thermal management advantage of LEDs over HPS is real but not unlimited. Hundreds of LED fixtures in a sealed room still generate substantial heat.
What many facility designers underestimate is the dehumidification side. LED fixtures run cooler than HPS, which means leaf surface temperatures drop. Cooler leaf surfaces reduce transpiration rates compared to HPS environments, but the sealed room still accumulates moisture from irrigation, growing media, and plant respiration. The net effect: switching from HPS to LED often shifts the primary HVAC challenge from sensible cooling (removing heat) to latent load management (removing moisture).
Practitioners report that facilities converted from HPS to LED frequently need to upsize or reconfigure dehumidification capacity even as they downsize cooling. A common mistake is calculating HVAC savings based only on reduced BTU load from lighting without accounting for the changed dehumidification dynamics. For a deeper explanation, see latent vs. sensible heat for controlled environment agriculture.
Fixture architecture matters here too. Centralized power systems that relocate drivers outside the grow space reduce in room heat generation, directly cutting both sensible cooling and the secondary humidity effects of elevated room temperature. For more on how lighting decisions cascade into climate management, see this piece on humidity control in cannabis facilities.
Photoperiod
The number of hours per day that lights are on. Cannabis is a photoperiod sensitive plant: vegetative growth typically runs under 18/6 (18 hours on, 6 off), while flowering is triggered by switching to 12/12. DLI calculations depend on photoperiod length, which is why two facilities running different light schedules need to think in terms of daily light delivery, not just instantaneous PPFD.
Key Takeaways
Commercial cannabis lighting decisions should be based on measurable performance rather than marketing claims.
When comparing fixtures, prioritize photon efficacy, PPFD uniformity, DLC certification, electrical efficiency, and long term operating costs instead of wattage alone. Facilities that optimize the entire lighting system, including fixture layout, environmental controls, under canopy supplementation, and rebate opportunities, typically achieve better yields, lower operating costs, and a faster return on investment.
Whether you’re planning a new cultivation facility or upgrading from HPS, understanding the terminology in this glossary will help you evaluate lighting systems with confidence.
Quick Reference Table: Critical Metrics for Commercial Cannabis
| Metric | Unit | What “Good” Looks Like | Why It Matters |
|---|---|---|---|
| Photon Efficacy (PPE) | µmol/J | Above 2.5, top tier above 2.8 | Every 0.1 gain cuts energy ~3% |
| PPFD (Flowering) | µmol/m²/s | 800 to 1,500 (with CO₂) | Drives flower weight and density |
| DLI (Flowering) | mol/m²/day | 40 to 45 (max useful ceiling) | Total light determines growth rate |
| Watts per sq ft (LED) | W/ft² | 30 to 40 actual draw | Sizing and electrical planning |
| DLC PPE Threshold | µmol/J | 2.3 to 2.7 (varies by type) | Required for utility rebates |
| IP Rating | IP## | IP65 or higher | Humidity and spray protection |
| Fixture Lifetime | Hours | 40,000+ | No lamp replacements over life |
| Warranty | Years | 5 minimum | Risk protection at scale |
| PPFD Uniformity | % | ±5 to 10% design to install | Consistent flower quality room wide |
| HPS to LED Payback | Months | 12 to 18 (before rebates) | Financial justification |
| Under Canopy PPFD | µmol/m²/s | 200 to 300 at flower sites | Lower canopy bud development |
| Input Voltage | V AC | 100 to 277V universal | Electrical infrastructure compatibility |
Frequently Asked Questions
What is the most important spec when comparing commercial cannabis LED grow lights?
Photon efficacy (PPE), measured in µmol/J. It tells you how efficiently a fixture converts electricity into plant usable light. Two fixtures drawing the same wattage can have wildly different light output. PPE is the great equalizer. Look for 2.5 µmol/J or better for serious commercial operations.
How much PPFD do cannabis plants need during flowering?
Cannabis requires 800 to 1,500 µmol/m²/s during flowering, depending on whether CO₂ is supplemented. Without CO₂, pushing past 1,000 µmol/m²/s offers diminishing returns. With CO₂ at 1,200 to 1,500 ppm, plants can productively use up to 1,500 µmol/m²/s. Treat published ranges as starting points and adjust based on how your specific cultivars respond.
Do I need DLC listed fixtures for my commercial grow?
If you want utility rebates, yes. DLC certification is the standard most utility companies require before approving rebate applications for LED grow lights. Beyond rebates, DLC listing provides third party validation that a fixture meets minimum efficacy and quality standards. Always verify a fixture’s listing on the DLC Qualified Products List before purchasing.
What’s the real ROI timeline for switching from HPS to LED?
Most facilities achieve payback within 12 to 18 months through the combination of 30 to 50% lower electricity bills, reduced HVAC costs, elimination of annual bulb replacements, and improved yields. Utility rebates can compress this timeline further, sometimes to under a year.
Are bar style LED fixtures better than quantum boards or COBs for commercial cannabis?
For commercial operations, bar style (multi bar) fixtures are the clear preference. They distribute light more evenly across large canopy areas, eliminating the hot spot problem inherent to single board (panel) and COB designs. Panels and COBs work in small spaces, but uniformity at scale is where multi bar fixtures earn their premium. COBs in particular have been largely superseded because their point source geometry requires excessive mounting height to achieve reasonable coverage.
How much can under canopy lighting increase yields?
Independent studies and commercial grower reports consistently show 20 to 30% yield increases from properly implemented under canopy lighting, with some operations reporting gains up to 60% in dense, multi layer configurations. The key is adding light where overhead fixtures can’t reach, converting low value “popcorn buds” into fully developed flower.
What PPFD should under canopy bars deliver to lower bud sites?
Target 200 to 300 µmol/m²/s measured at the surface of lower flower sites. This range brings shaded tissue above the productive photosynthesis threshold without overstressing tissue adapted to low light. Position bars 6 to 12 inches from the nearest flower tissue and use dimming to fine tune intensity as the canopy develops.
What rebates are available for commercial cannabis LED grow lights?
Rebate programs vary by utility and region. Examples include PG&E offering $79 per fixture for LEDs with PPE of 2.86 or higher, and Xcel Energy offering $0.80 to $1.00 per watt installed. Programs can offset 30 to 70% of fixture cost. The most important step: get pre approval in writing before placing your order.
Does spectrum really matter, or should I just maximize PPFD?
At high photon flux levels, research indicates that efficacy and fixture cost matter more for ROI than fine tuning spectral distribution. Full spectrum white LEDs (3000K to 3500K) with supplemental 660nm red diodes cover cannabis needs across all growth stages. Spending extra on exotic spectrum channels at the expense of total PPFD or PPE is usually the wrong trade off for commercial facilities.
Is programmable spectrum worth the extra cost?
For most commercial single cultivar or limited rotation facilities, no. The marginal gains from spectral tuning rarely justify the added fixture cost, complexity, and potential efficacy trade offs. Research facilities and multi cultivar operations with documented spectral preferences are the exception. Remote dimming and scheduling controls, on the other hand, are universally valuable and should be considered essential.
What input voltage should I specify for my grow facility?
Most commercial LED fixtures accept 100 to 277V AC. For new builds, 277V is preferred because it reduces amperage per fixture, allowing smaller wire, fewer circuits, and lower electrical installation costs. Always confirm the fixture’s input range matches your panel voltage before ordering.
How does switching to LED change my dehumidification needs?
LEDs run cooler than HPS, which lowers leaf temperatures and shifts the primary HVAC challenge from removing sensible heat to managing latent moisture load. Many facilities that convert from HPS to LED discover they need to reconfigure or upsize dehumidification even as cooling requirements drop. Always model both sensible and latent loads before finalizing your HVAC design.
Choosing the right commercial cannabis LED grow lights is a capital decision that affects energy costs, yield quality, and facility operations for years. If you’re planning a new build, retrofit, or HPS to LED conversion, schedule a free consultation to get facility specific guidance from a lighting engineer.